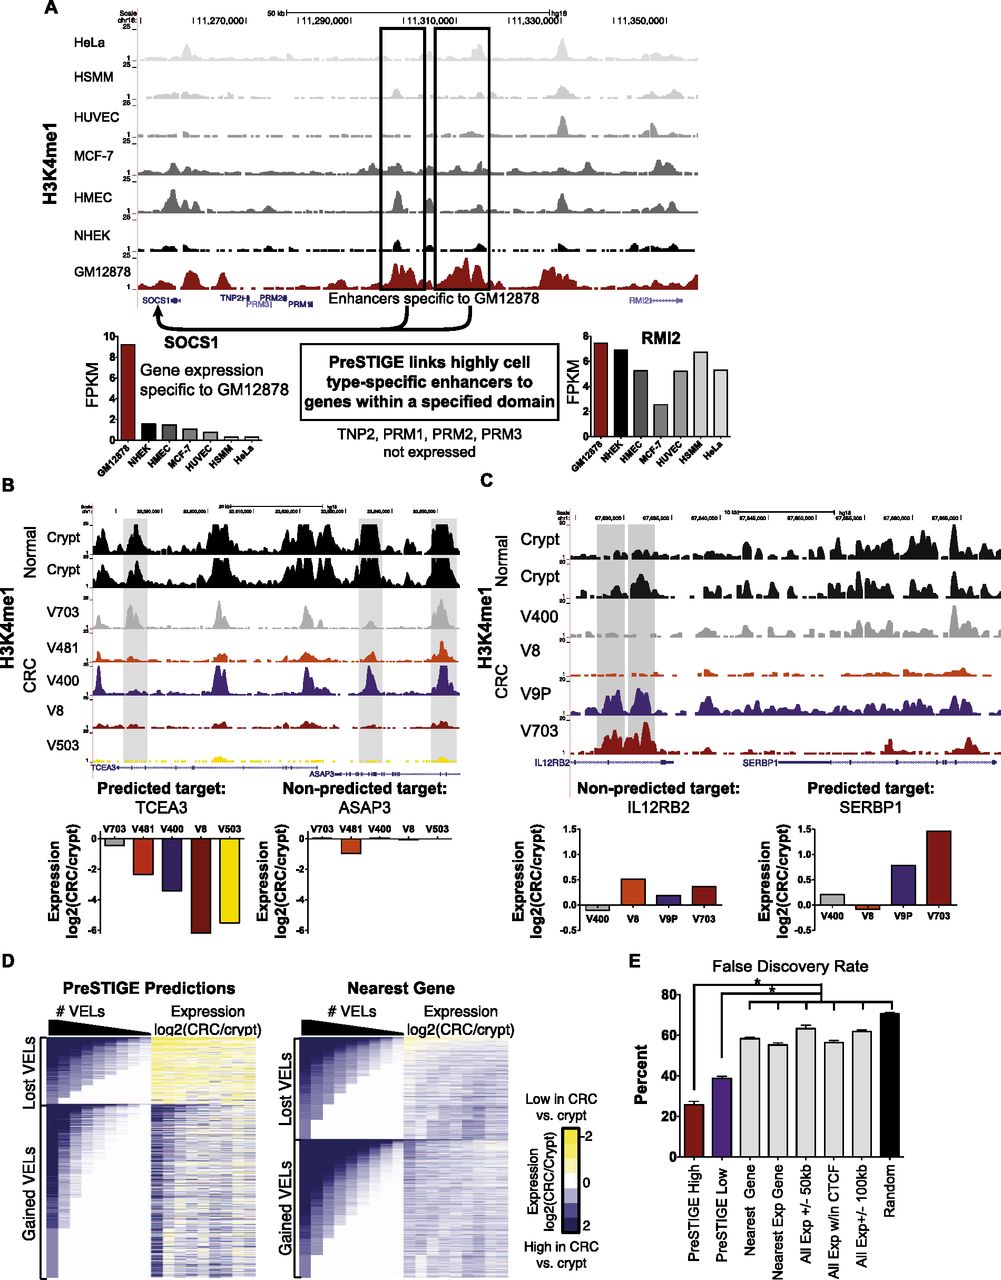
PreSTIGE methodology and FDR. (A) PreSTIGE links cell type-specific enhancers to genes specifically expressed in the same cell type. GM12878-specific H3K4me1 sites outlined in black are predicted to interact with the SOCS1 promoter, and not the RMI2 promoter. Levels of SOCS1 and RMI2 transcripts quantified by RNA-seq in each cell type. (FPKM) Fragments per kilobase of transcript per million fragments mapped. (B) UCSC Genome Browser image of putative enhancers lost in CRC (lost VELs) relative to normal colon crypts. The three H3K4me1 sites highlighted in gray are predicted to target TCEA3 in the colon crypts. Gene expression in the colon cancer cell lines relative to the colon crypt for the predicted target, TCEA3, and nonpredicted control gene, ASAP3. Note that TCEA3 levels are reduced in CRC lines containing lost VELs while ASAP3 is unaffected. (C) UCSC Genome Browser image of a representative gained enhancer locus (gained VEL). The H3K4me1 sites highlighted in gray are predicted to target SERBP1 in CRC lines V9P and V703. Gene expression in the colon cancer cell lines relative to the colon crypt for the predicted target SERBP1 and nonpredicted control gene IL12RB2. Note that SERBP1 expression is elevated in lines containing gained VELs while IL12RB2 is unaffected. (D) Heatmap showing overall correlation between VELs and gene expression. The left side of the heatmap corresponds to the number of lost (top) or gained (bottom) VELs associated with each gene (rows) in each of the nine CRC cell lines (columns). Dark blue denotes multiple VELs, whereas white indicates no VEL. The right side of the heatmap is ordered identically to the left side, and illustrates the change in expression (CRC/crypt) of the genes associated with the VELs by PreSTIGE (left) and the nearest gene to the VEL (right). (E) Approximation of PreSTIGE FDR (mean ± SEM) based on colon cancer VEL data compared with five commonly used computational methods. (*) P < 0.003, by paired t-test.