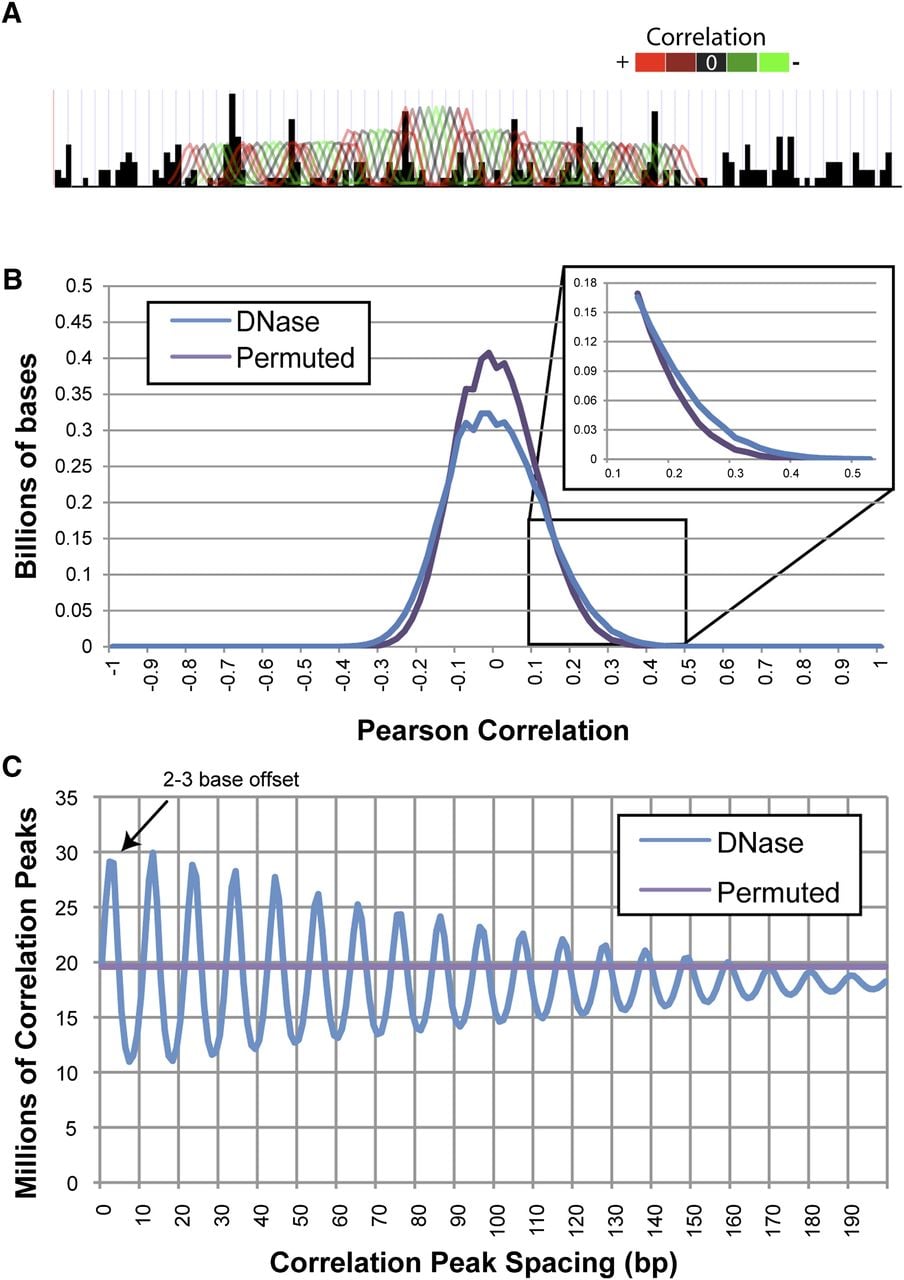
Figure 3.
Correlating DNase-seq data to expected nucleosome pattern. (A) The expected 91-bp pattern of DNase I digestion around the nucleosome (Supplemental Fig. S3A) was correlated with the DNase-seq data at each base across the genome. (B) The distribution of correlation scores shows that DNase has more positive and negative values at the extremes compared with the permuted data set. (C) The distances between correlation peaks on the plus and minus strands in DNase-seq data and the permuted DNase-seq are plotted. Note that the 3-bp offset of the ∼10 bp between correlation peaks on opposite strands is only detected in the DNase data.