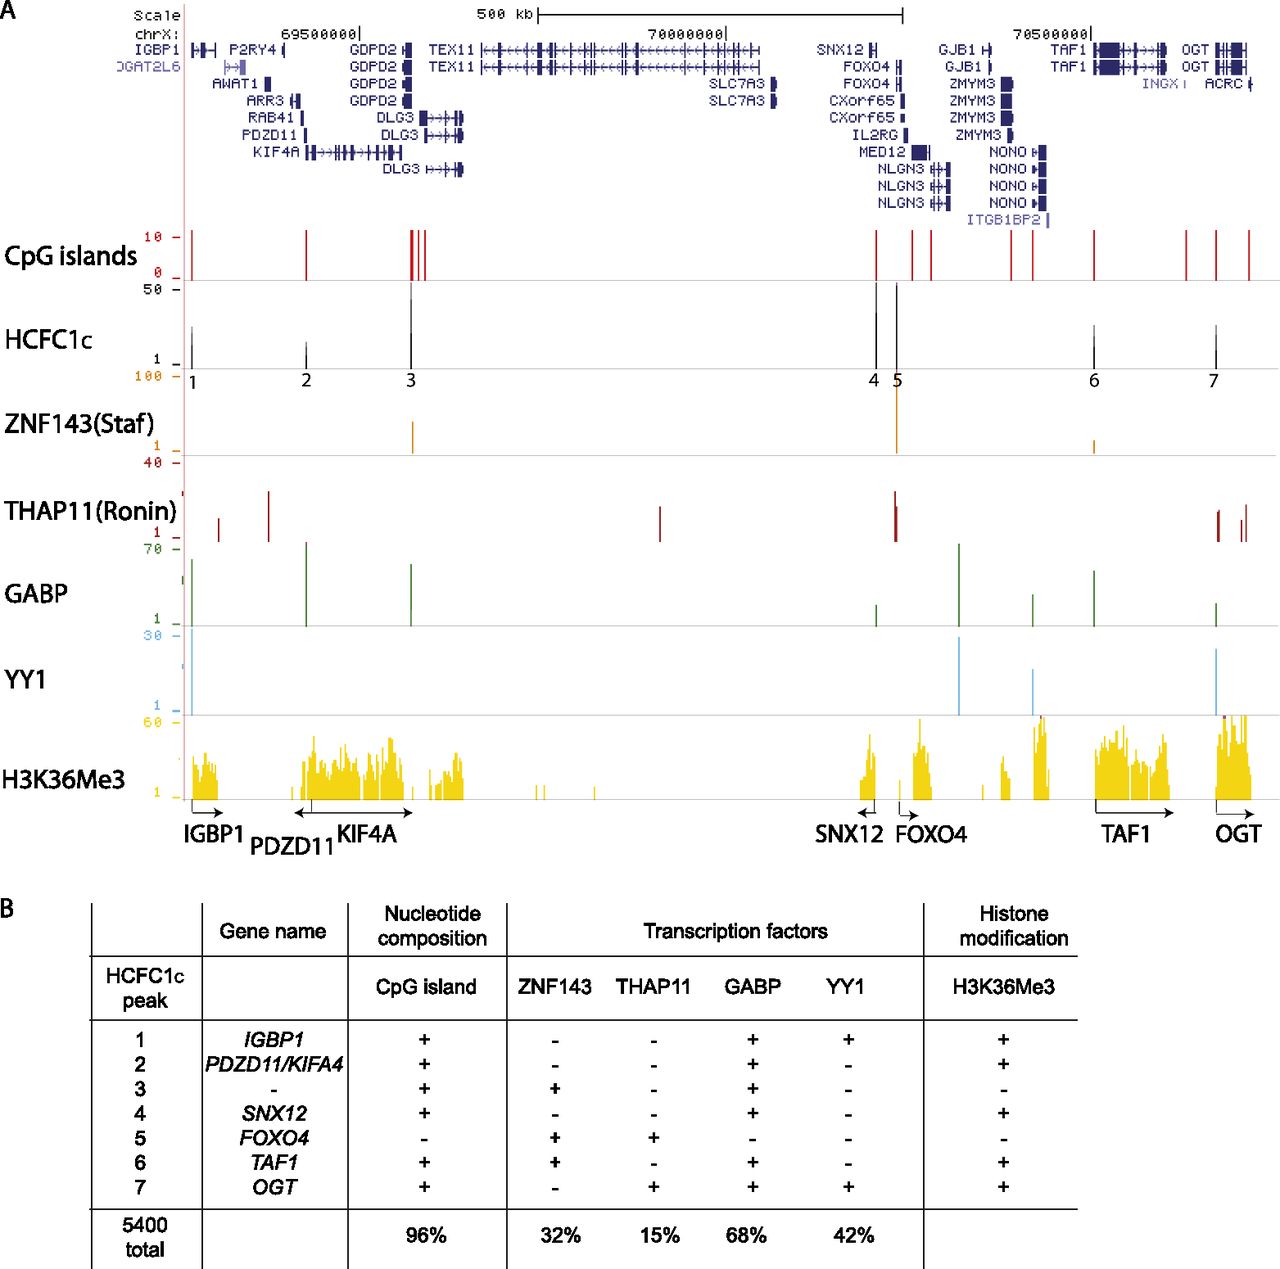
Figure 7.
Correlation between HCFC1 and transcription-factor binding patterns. (A) Genome distribution of peaks for HCFC1C and ZNF143, THAP11, GABP, and YY1 transcription factors. CpG islands (Illingworth et al. 2010) are indicated. Actively transcribed transcription units are indicated using the H3K36Me3 distribution. Genes bound by HCFC1 and actively transcribed are indicated at the bottom of the figure along with their direction of transcription. (B) Summary of the distribution of the transcription-factor binding sites, CpG islands, and H3K36Me3 status for HCFC1-bound TSSs. The global percentage of HCFC1C-bound TSSs containing each of the described features is indicated at the bottom.