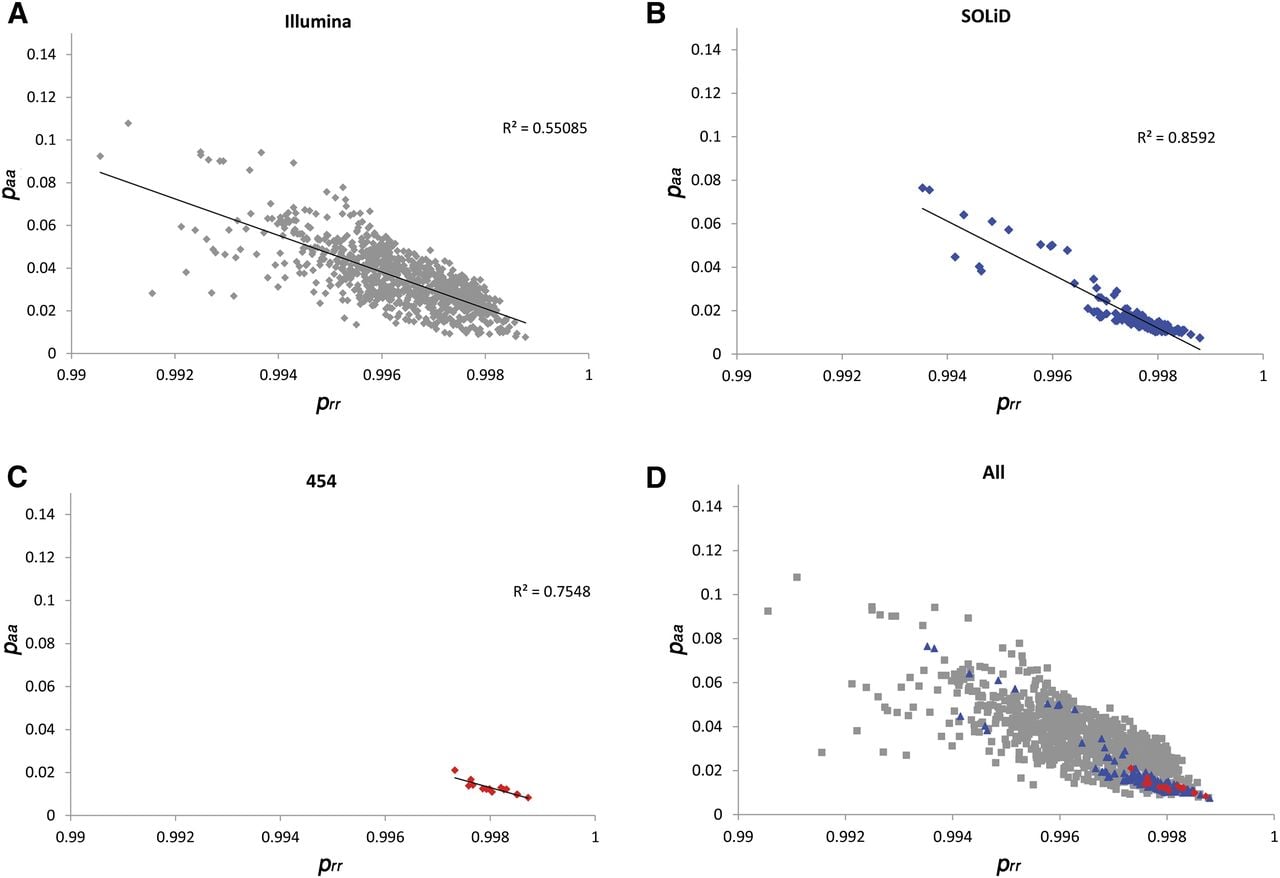
Evaluation of estimated binomial probabilities by plotting all BAMs. BBMM models each BAM as a mixture of three binomials. For each sample on each NGS platform (Illumina, SOLiD, and Roche 454), we plot the binomial probability prr vs. paa. The error free expectation for these values is 1 and 0, respectively. As the binomial probability accounts for sequencing variation within a sample, we expect correlation between these two values. (A–C) We find that correlation is highest for SOLiD samples and lowest for Illumina samples. (D) While the binomial probabilities do vary between samples, BBMM is able to model variation within each sample even if they are sequenced using different technologies. Samples located in the top left corner of the plot (high-sequencing variability/error), upon further examination, are low quality due to known operational mishaps.