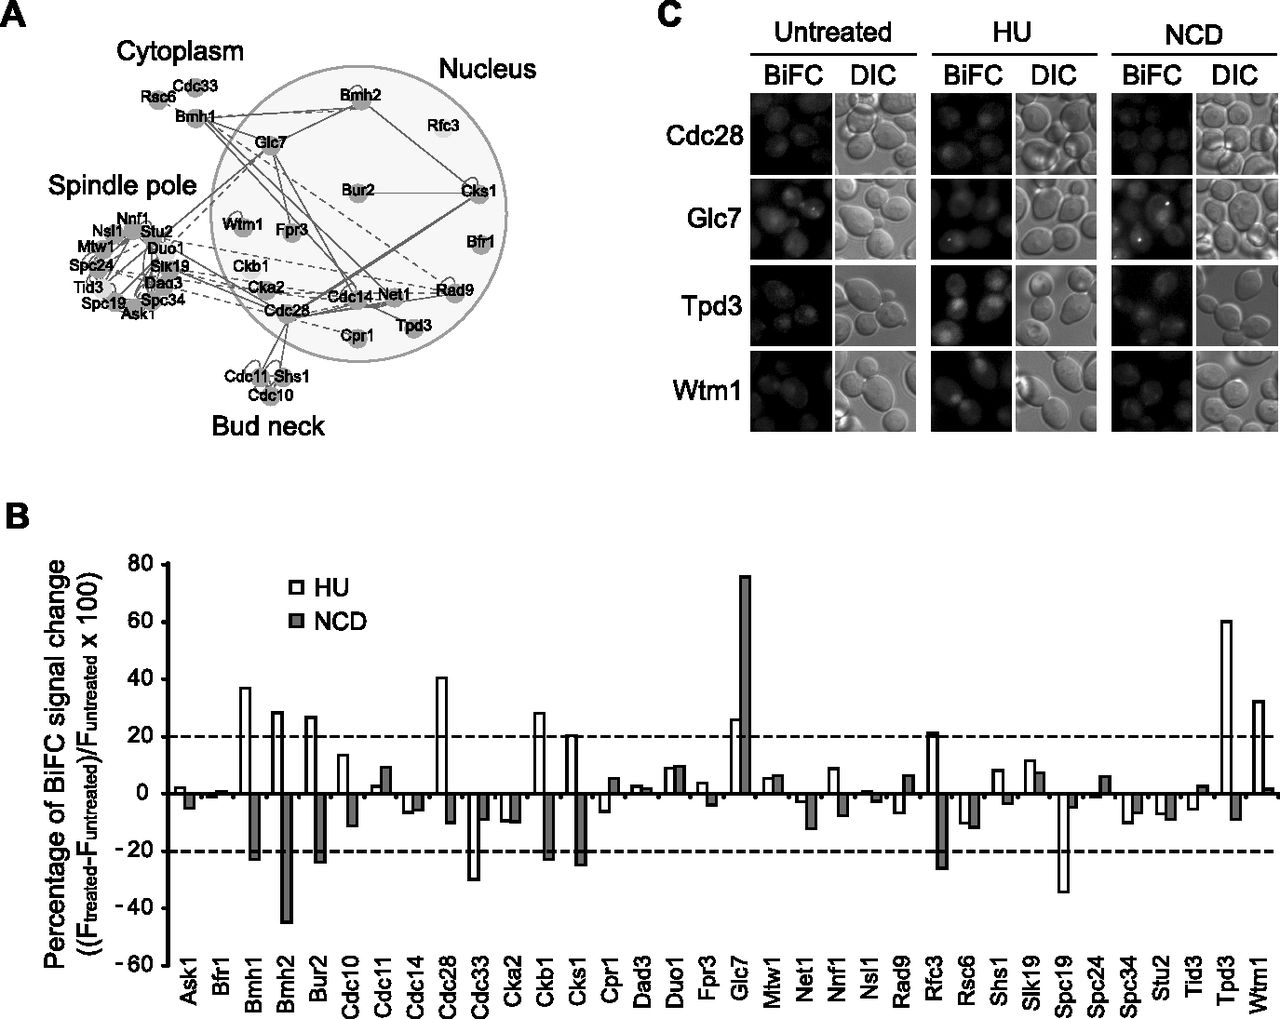
Cell cycle and the SUMO pathway. (A) A SUMO subnetwork highlighting the relationship between cell-cycle progression and the SUMO pathway. The dark gray and light gray circles represent class I and class II substrates, respectively. The solid and dashed lines indicate physical and genetic interactions between two proteins, respectively. (B) Quantitative analysis of SUMO interaction of 34 cell-cycle-related proteins in the presence of hydroxyurea or nocodazole. Cells coexpressing the corresponding VN-tagged proteins and VC-tagged Smt3 were grown to mid-log phase in synthetic medium, aliquoted, and treated with 0.2 M hydroxyurea or 15 μg/mL nocodazole. After incubation for 3 h, the percentage of the change in BiFC signal intensity of cells was analyzed. For the quantification of the BiFC signals, the mean fluorescence intensity of 20 cells for each strain was measured with custom software written in MATLAB (Mathworks). HU and NCD indicate the treatments with hydroxyurea and nocodazole, respectively. (Dashed lines) A cut-off value of ±20%. (C) Fluorescence images of cells coexpressing the corresponding VN-tagged proteins and VC-tagged Smt3 in the presence of hydroxyurea or nocodazole. Cells were grown and treated with the inhibitors as described above.