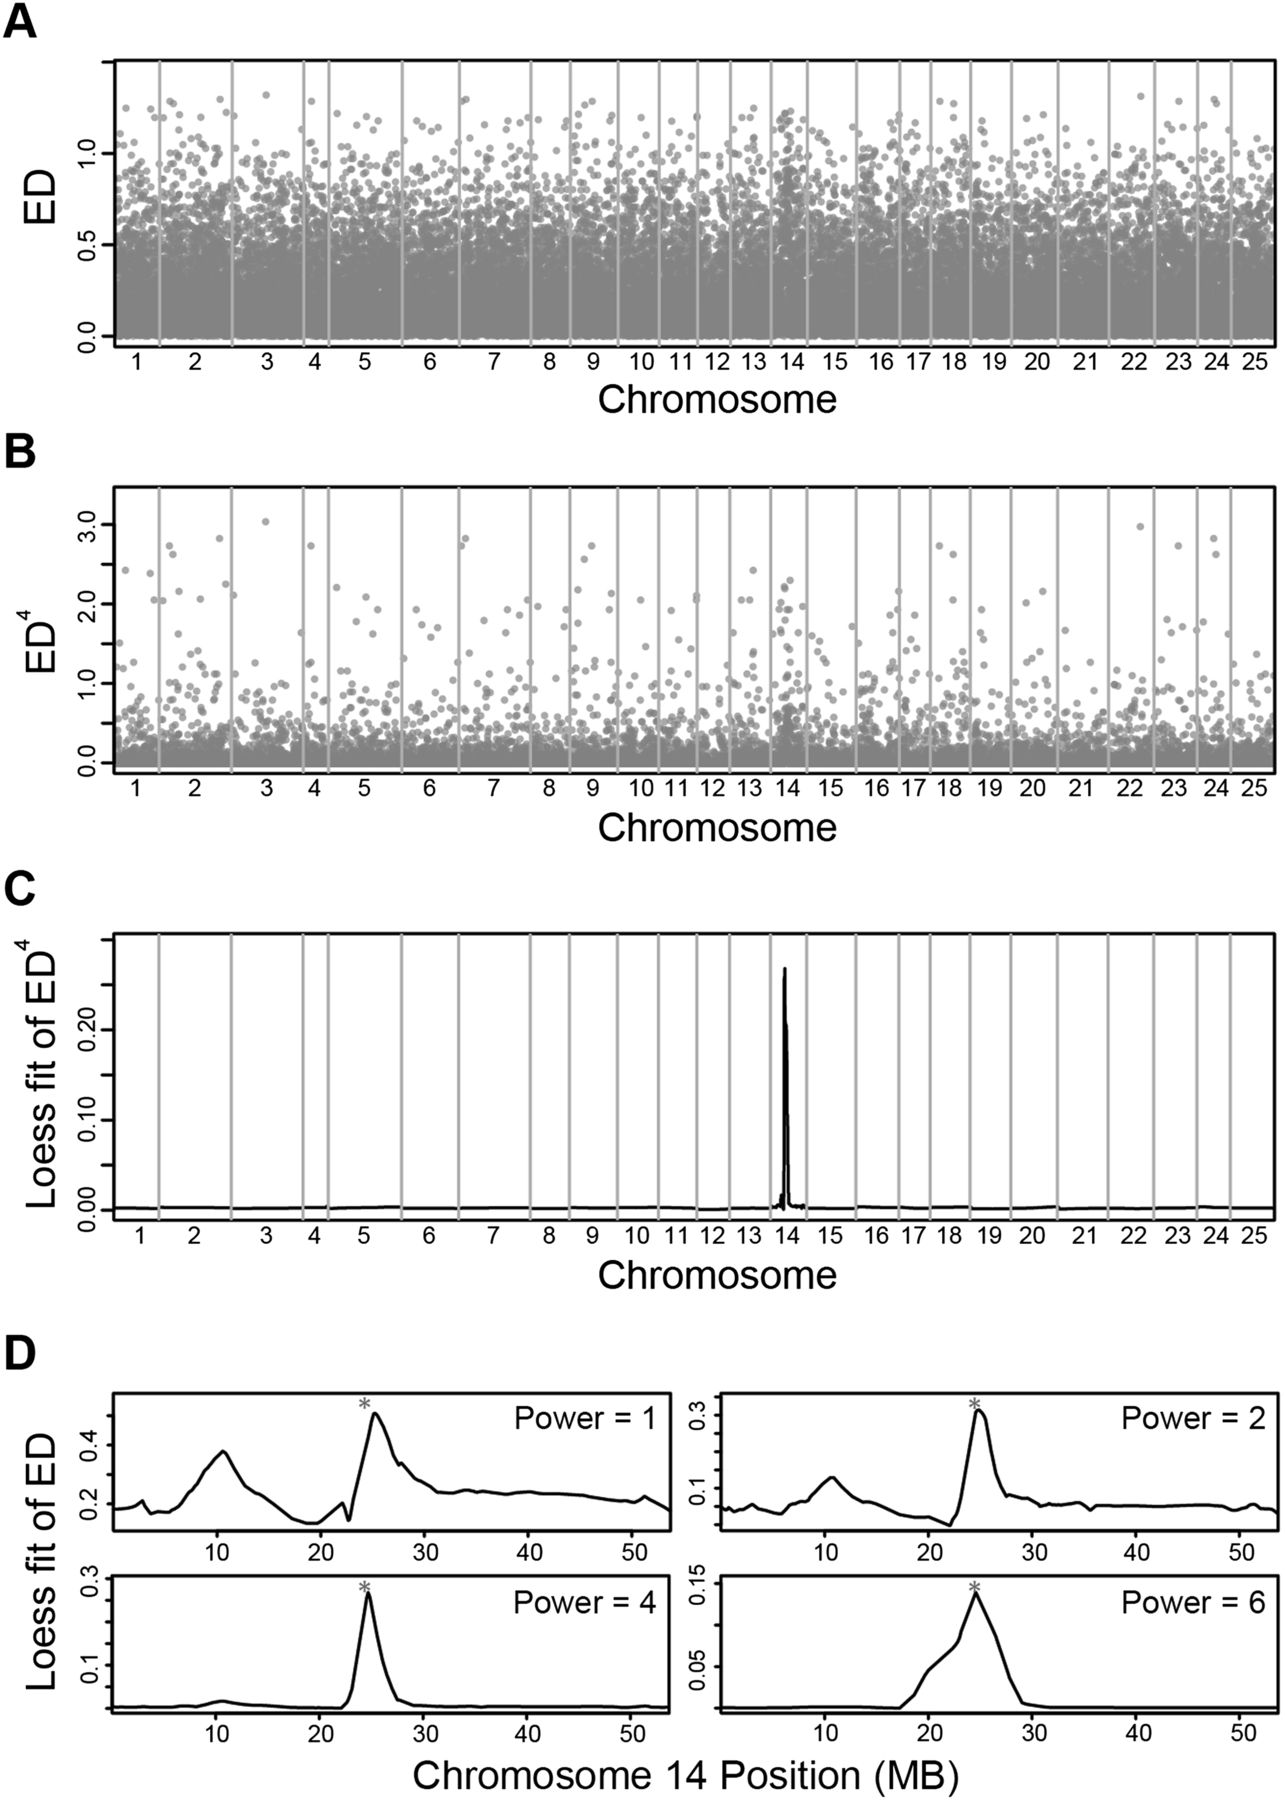
Figure 3.
Data progression through noise reduction steps. (A) Raw Euclidean distance scores across the genome. For all panels, vertical gray lines delineate chromosome edges, and chromosome widths represent the relative number of SNPs on the chromosome. (B) Euclidean distance raised to the fourth power. (C) Loess fit curve calculated using the data shown in B. (D) Effect of raising the Euclidean distance to different powers on the Loess fit curve. All data are from the nkx2.5 mutant and phenotypically wild-type RNA-seq data sets. (*) The mutation location.