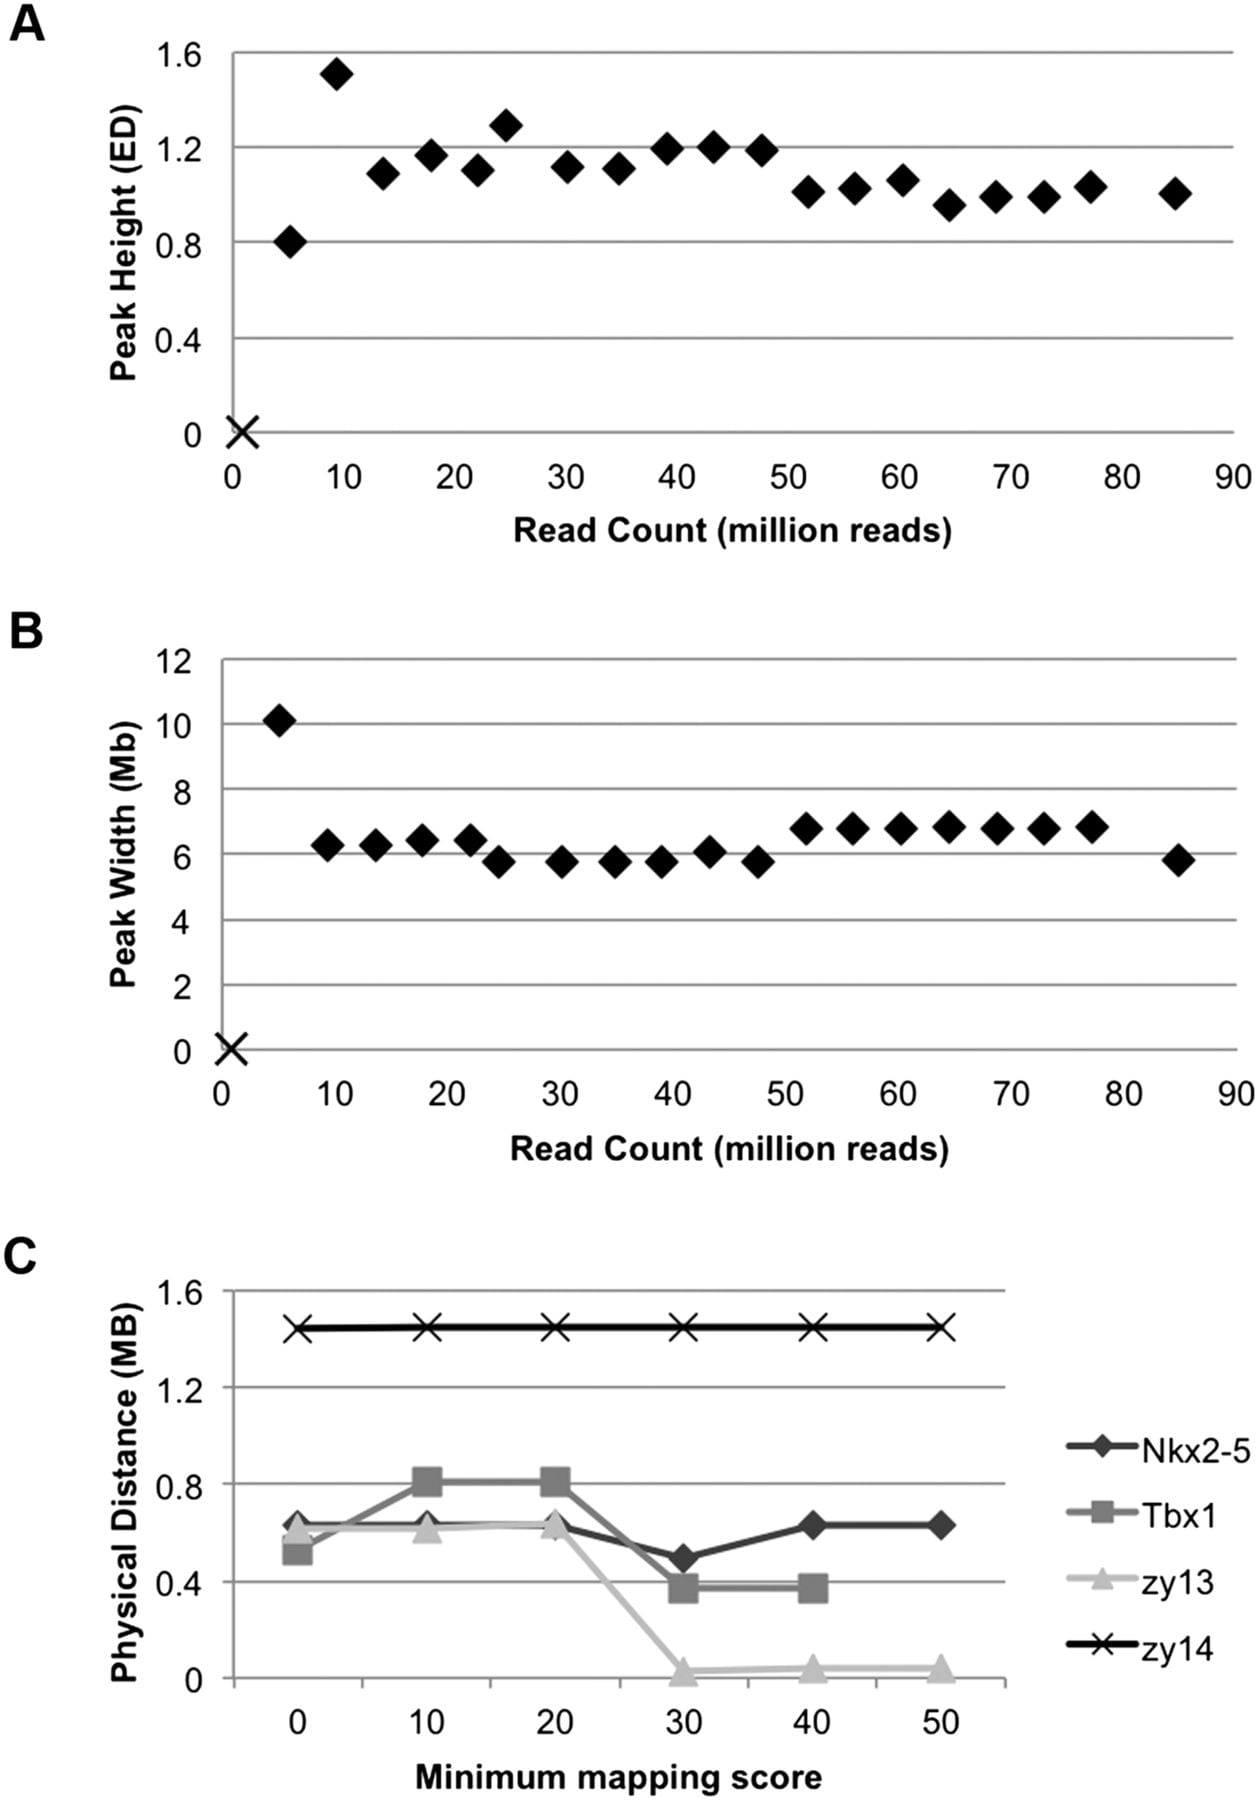
Figure 2.
Effect of various parameters on peak width, height, and location. Reads were randomly sampled from the combined zy14 data set to create 20 data sets with 1%–100% of the original data. (A) The width of the peak in each data set. (B) The height of the peak for the same data sets. The 1% data set did not have a sufficient number of SNPs to identify a peak (X in A and B). (♦) All other data sets. (C) The effect of different mapping quality scores on peak location (distance of the peak maximum from the identified mutation). Mapping quality had little effect on peak position, but the best overall position for all data sets was at a phred-scaled mapping quality score threshold of 30.