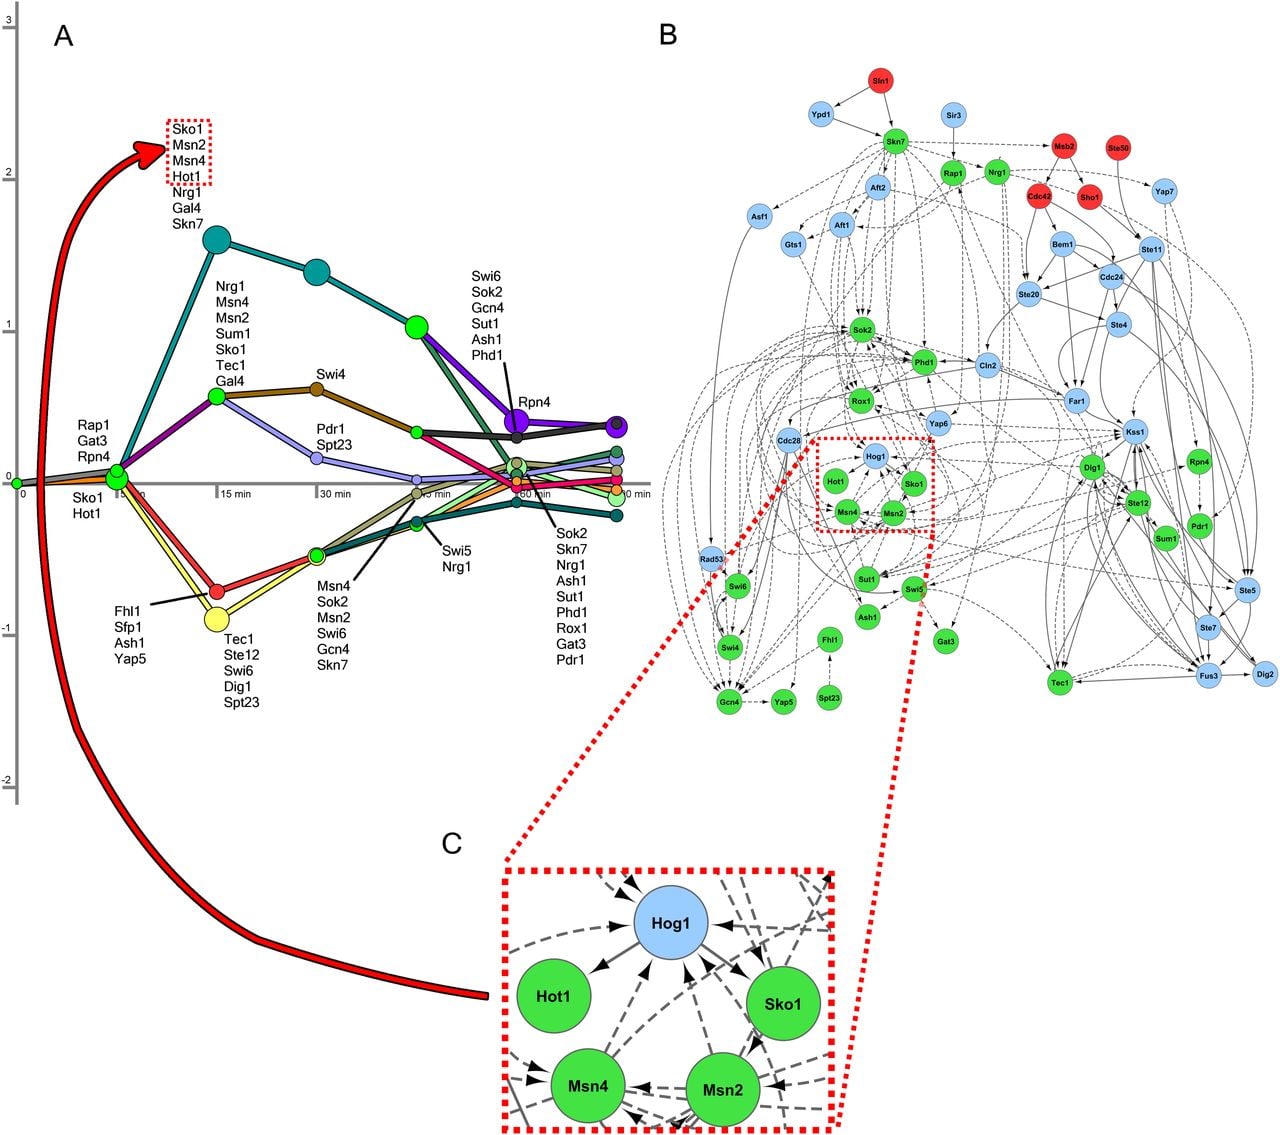
Figure 3.
Long osmotic stress model. (A) The regulatory model for the long osmotic stress expression data contains nine paths. The initial splits overlap with those in the short model in terms of the TFs predicted to control them. (B) The sources, signaling proteins, and active TFs in the long model are shown. Again, there is a large overlap with the signaling model from the short time-series data set. (C) The primary TFs of the osmotic stress response are recovered in the long model as well. Hog1 and Sko1 are shown a second time along the uppermost regulatory path to emphasize the connection between the signaling and regulatory components.