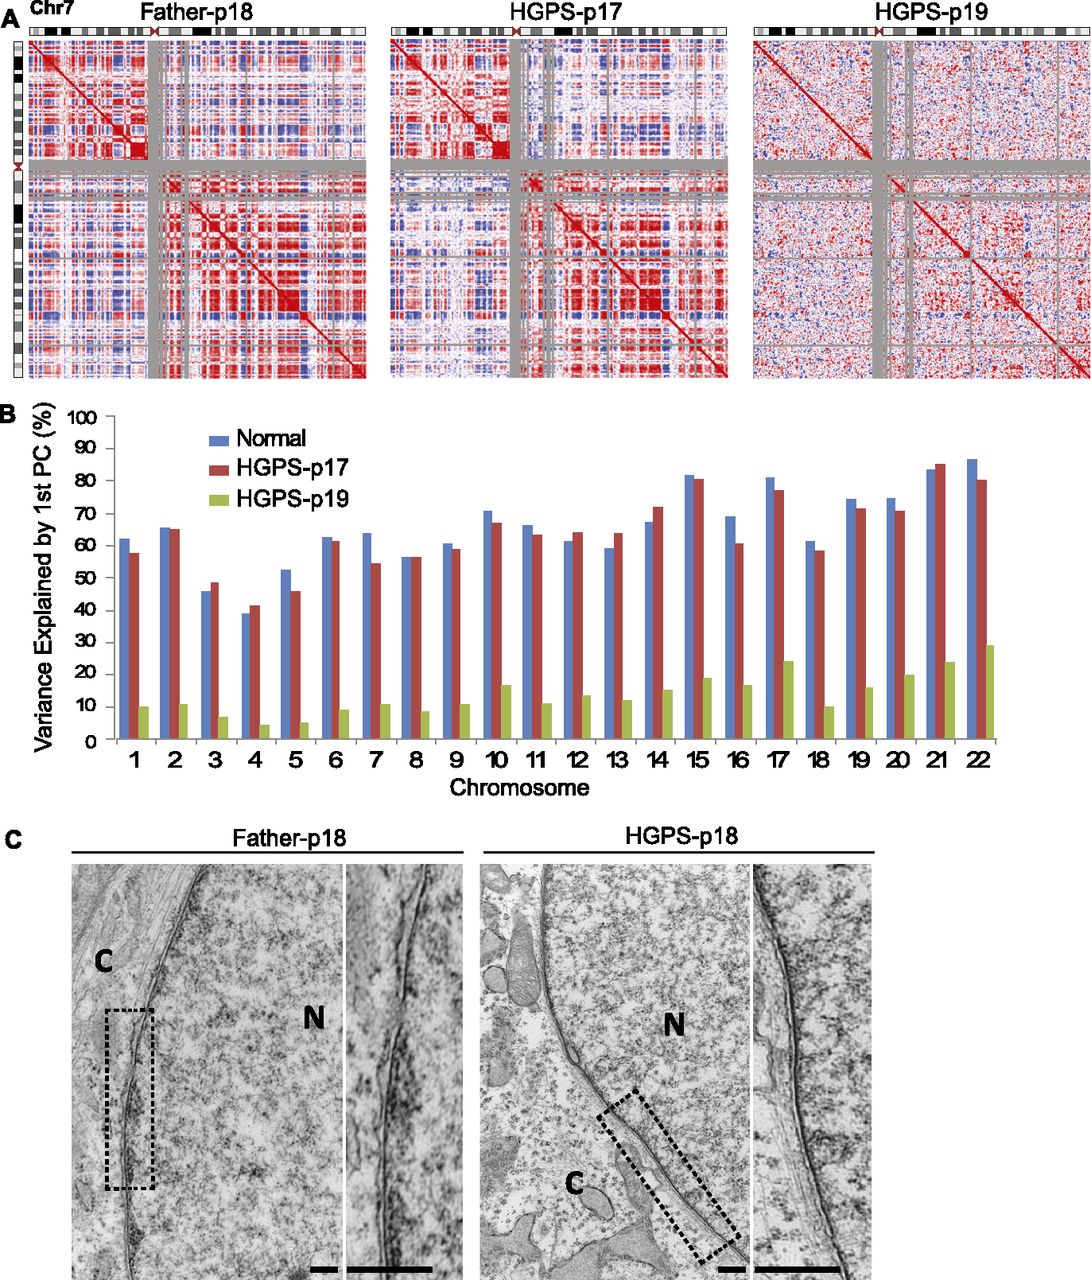
Loss of compartments in prematurely senescent HGPS fibroblast cells. (A) Pearson correlation maps of chromosome 7 reveal the compartment structure of the genome (red and blue “plaid” pattern). Compartments are clearly visible in Father control fibroblasts at passage 18 (left) and show subtle changes in HGPS cells at passage 17 (middle), but compartments are lost in senescing HGPS cells at passage 19 (right). (B) The percentage of the Hi-C data explained by the compartment eigenvector (first principal component) is shown for each chromosome. The compartment signal explains a large proportion of the variance in normal cells (blue; average of % explained from Father and Age Control samples tested). This percentage explained decreases slightly in HGPS-p17 cells (red) and then global decreases in HGPS-p19 cells (green). (C) Electron microscopic observations of HGPS-p18 and Father-p18 fibroblasts. A high-magnification view showed a normal array of heterochromatin adjacent to the nuclear envelope (Father, left). A higher-magnification view of an HGPS cell showed a loss of peripheral heterochromatin (right). Compared with Father control, the chromosomes in HGPS nucleus exhibit a loss of higher-order genome organization (scale bars, 500 nm). (N) Nucleus; (C) cytoplasm.