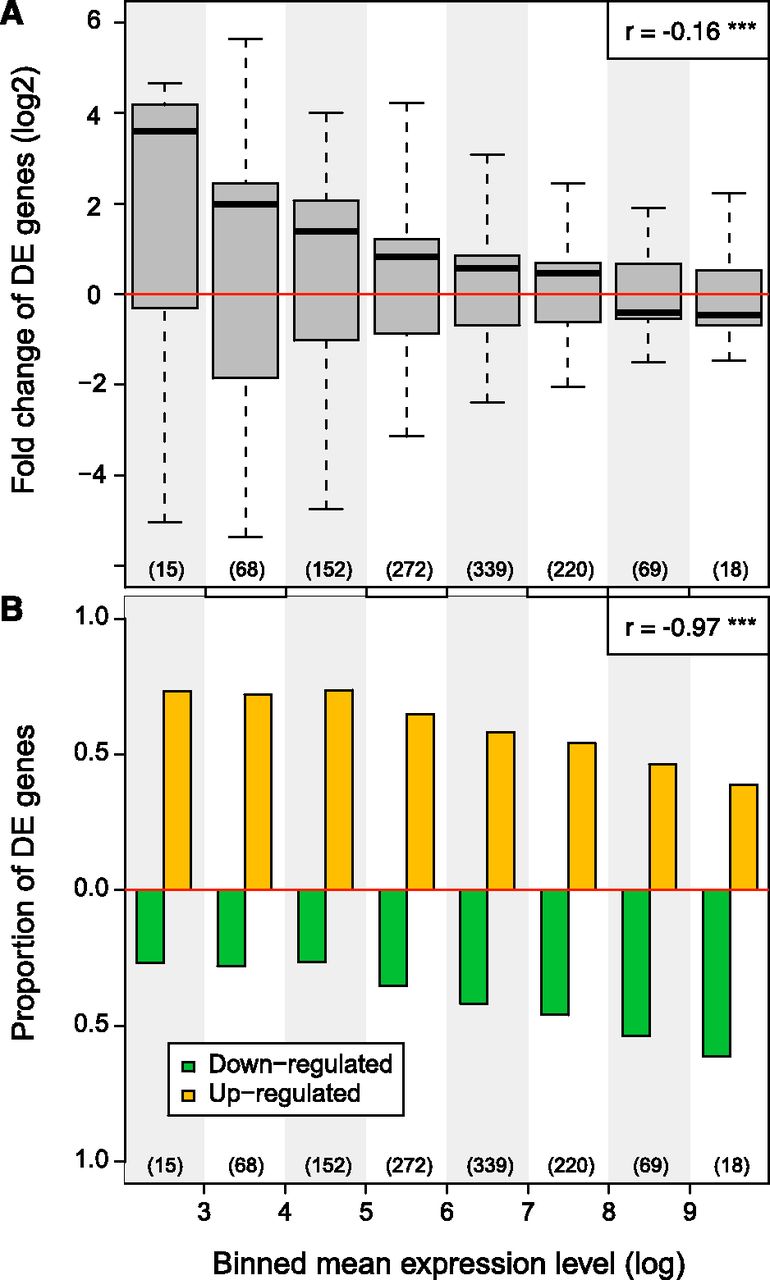
Cohesin depletion compresses the dynamic range of gene expression. (A) Genes were stratified into 10 equally sized log intervals from low (0–1) to high (>9) based on the average gene expression of control and cohesin-deficient thymocytes. Boxplots indicate the distribution of gene expression fold changes in cohesin-deficient thymocytes. The number of genes in each bin is indicated (bins 1 and 2 are empty). Note that lowly expressed genes are frequently up-regulated, whereas highly transcribed genes tend to be down-regulated. Note that this pattern does not result from ascertainment bias in which lowly expressed genes can only be up-regulated and vice versa, because we stratified genes according to the mean of their expression in control and cohesin-depleted cells. Therefore, the direction of regulation is the inverse when control cells are compared to cohesin-deficient cells (not shown). P-values are based on one-sample Wilcoxon signed-rank tests and indicate significant difference from zero (no change). Genes with zero mean expression in both cohesin-deficient and control thymocytes are excluded and outliers are not depicted. (B) Bar plot indicating the proportion of up- and down-regulated genes in each gene expression interval (see A). The proportion of up-regulated genes is anti-correlated with interval rank (Pearson's correlation coefficient r = −0.97, P < 10−4).