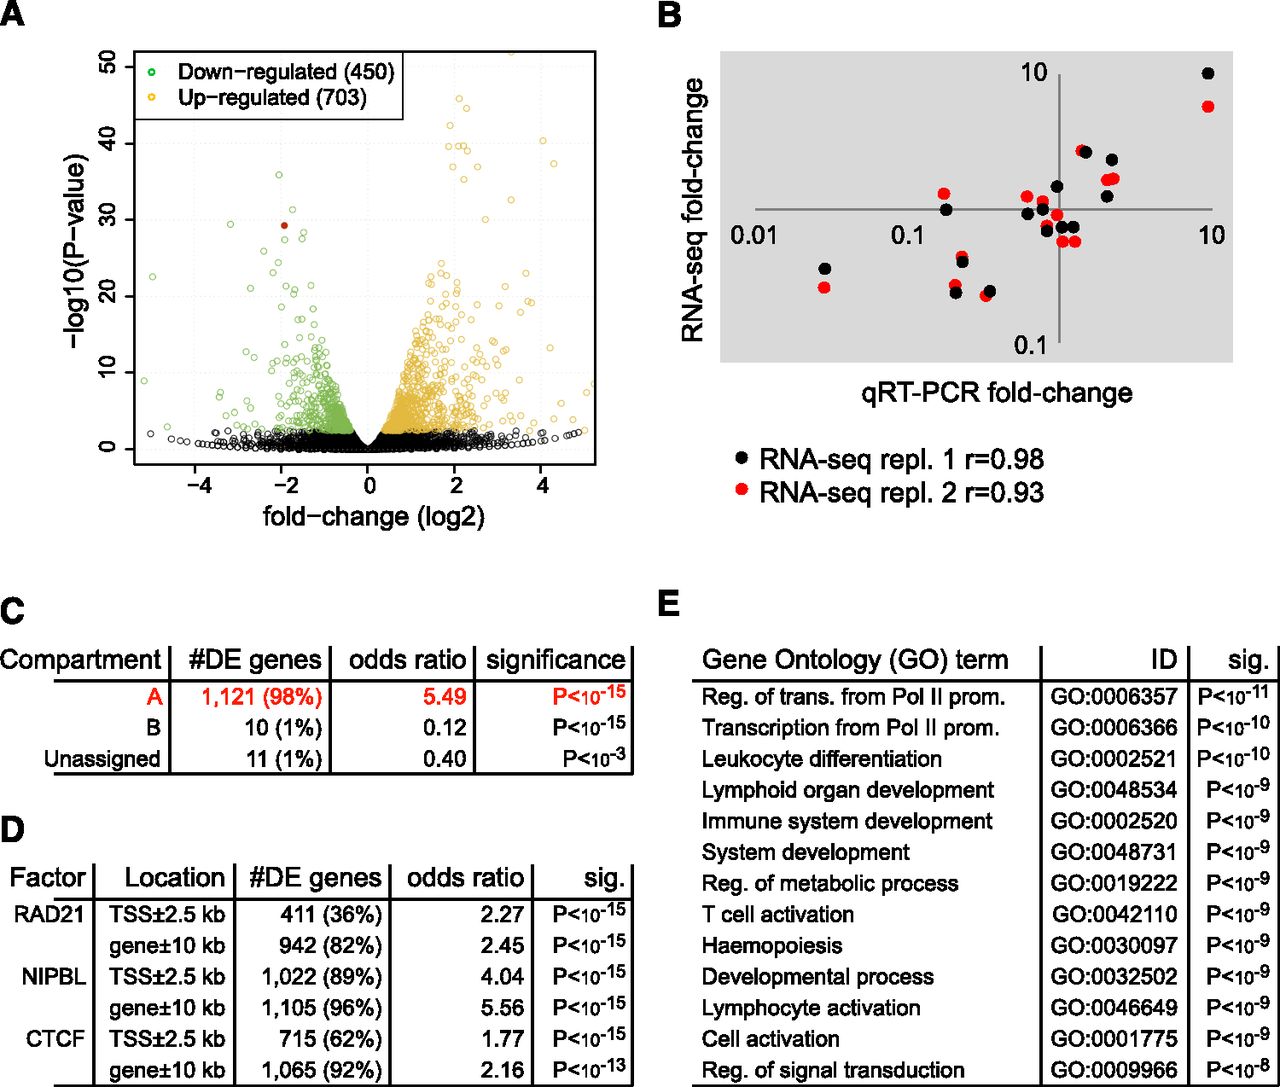
Gene expression in cohesin-deficient thymocytes. (A) Volcano plot of RNA-seq data. Of the 17,849 genes assayed, 1153 are significantly differentially expressed in cohesin-deficient thymocytes (FDR = 0.05), 450 of which are up-regulated (orange) and 703 down-regulated (green). The red dot represents Rad21. Eight genes above the −log10(P-value) = 50 threshold (all up-regulated) were omitted from the plot. (B) Validation of RNA-seq data for 15 transcripts over a wide range of expression levels. Shown is fold-change measured by qRT-PCR (x-axis, two independent biological replicates) against the fold-change measured by RNA-seq (y-axis) and the Pearson's correlation coefficient (r) for two independent RNA-seq experiments. (C) Genes affected by cohesin depletion are associated with open compartments. Approximately 98% of differentially expressed genes that could be assigned to compartments (1121 of 1142 autosomal and X-linked genes) reside in open (A) compartments, compared with 91.2% (16,255 of 17,819) of genes included in our analysis. Genes spanning more than one compartment were assigned to A when they overlapped at least partially with open compartments; genes overlapping compartments that could not be clearly defined as A or B because they were inconsistent between replicates were called unassigned. Only 21 deregulated genes were found outside open compartments. Of these, 11 were located in unassigned compartments and just 10 of 1142 deregulated genes were located in closed (B) compartments. This corresponds to a highly significant depletion of deregulated genes in B compartments (P < 10−15, odds ratio = 0.12). (D) Cohesin-regulated genes are bound by cohesin and associated factors. Associations are shown for ChIP-seq peaks for RAD21, NIPBL, and CTCF (Shih et al. 2012) within 2.5 kb of transcription start sites (TSS) and within 10 kb of canonical gene bodies. (E) Gene Ontology (GO) analysis of genes that are differentially expressed in cohesin-deficient thymocytes. Representative GO biological process terms with adjusted P < 10−8 are shown (the complete list can be found in Supplemental Table 2).