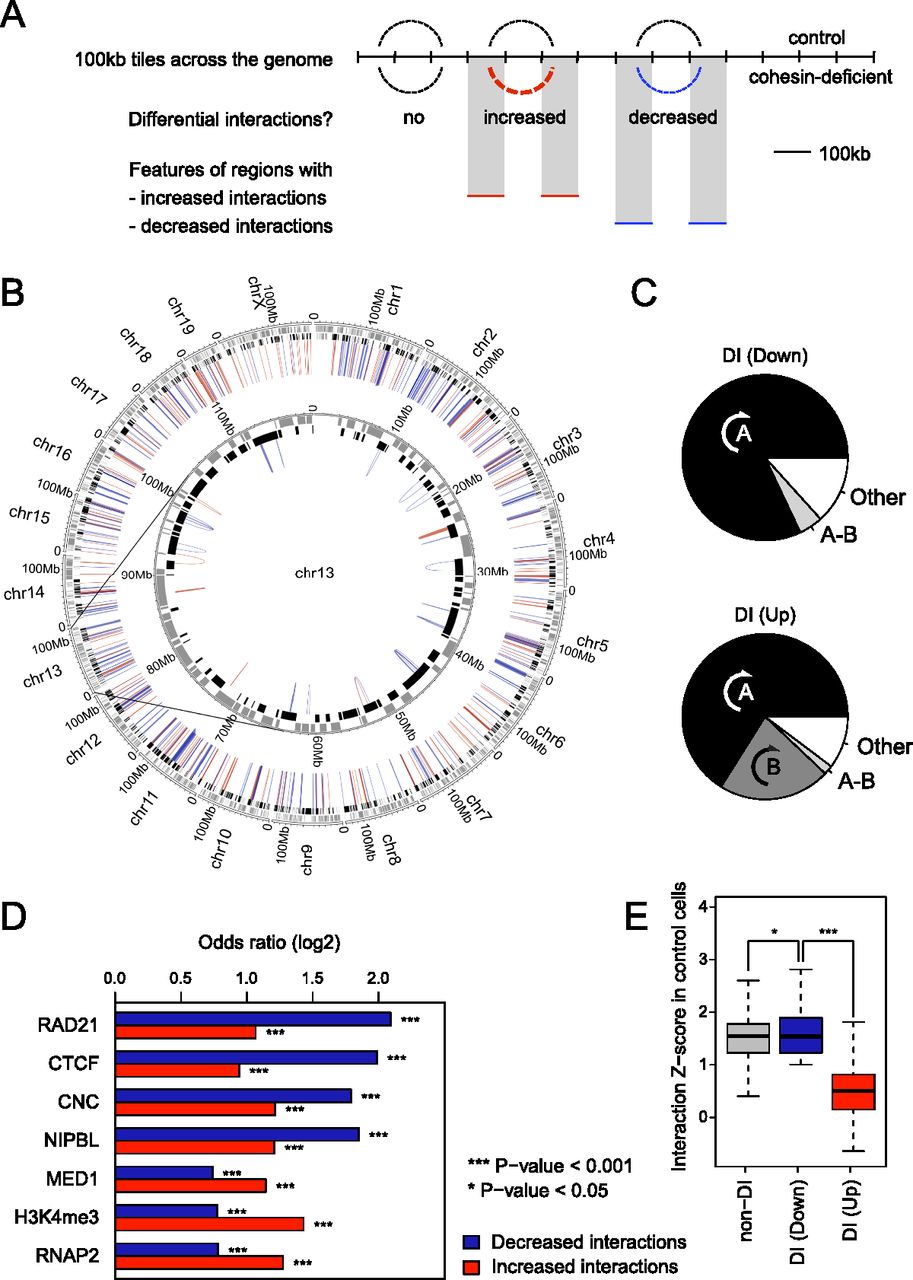
Cohesin binding predicts perturbed long-range interactions in cohesin-deficient thymocytes. (A) Schematic of approach for the mapping of differentially interacting regions. (B) Circos plot (Krzywinski et al. 2009) illustrating the chromosomal position of differential interactions in the context of chromosomal compartments. The HOMER software suite was used to determine significant interactions between 100-kb genomic regions in either control or cohesin-deficient thymocytes (FDR = 0.1; replicates pooled). Of 10,917 interactions that were significantly altered in the pooled samples, 1476 interactions changed in replicate 1 and 5004 in replicate 2 (P < 0.05; the remaining interactions were only seen in the pooled data). Of 502 differential interactions that were shared between replicates, 278 were decreased (blue) and 224 were increased (red). All differential interactions were intra-chromosomal. Compartment assignment is indicated at the base of the interactions: black for open compartments and gray for closed compartments. (C) Differential interactions in cohesin-deficient cells are largely contained within preexisting chromosomal compartments. (A) Differential interactions entirely contained within the same A compartment. (B) Differential interactions entirely contained within the same B compartment (the frequency of intra-B interactions was <2% among down-regulated interactions). (A-B) Differential interactions bridging A and B compartments. (Other) interacting regions are either unassigned (i.e., inconsistent between replicates) or bridge two distinct A or B compartments. Down-regulated interactions (top) and up-regulated interactions (bottom) are shown separately. (D) Features enriched in 100-kb regions that show differential interactions in cohesin-deficient thymocytes. Differential interactions between control and cohesin-deficient samples involved 946 unique 100-kb regions (510 involved in decreased interactions, 427 in increased interactions, and 9 involved in both) that participated in 502 unique differential interactions (278 that were decreased and 224 that were increased) and that were shared between replicates (P < 0.05). We tested whether differentially interacting 100-kb regions were enriched for the presence of Rad21, CTCF, NIPBL, MED1, H3K4me3, and RNAP2 binding events. See Supplemental Figure S1C,D for validation of the MED1 and NIPBL antibodies and ChIP, and Supplemental Figure S1E for an analysis of the relationship between RAD21, CTCF, and NIPBL ChIP-seq peaks. Differentially interacting regions were significantly enriched for the binding of the cohesin subunit RAD21, both with and without CTCF (cohesin-non-CTCF; CNC), and of the cohesin-associated factors CTCF and NIPBL, and features of transcriptional activity including MED1, H3K4me3, and RNA Pol II. Differential interactions were further classified into decreased and increased interactions. (E) Strength distribution of cohesin-dependent interactions. Using the number of Hi-C reads as an indicator of the strength of interactions, differential interactions that are decreased in cohesin-depleted thymocytes are similar in strength to unchanged interactions in control cells, whereas increased interactions tend to be weak before cohesin depletion (Mann-Whitney U-test P < 10−15). Outliers are not depicted.