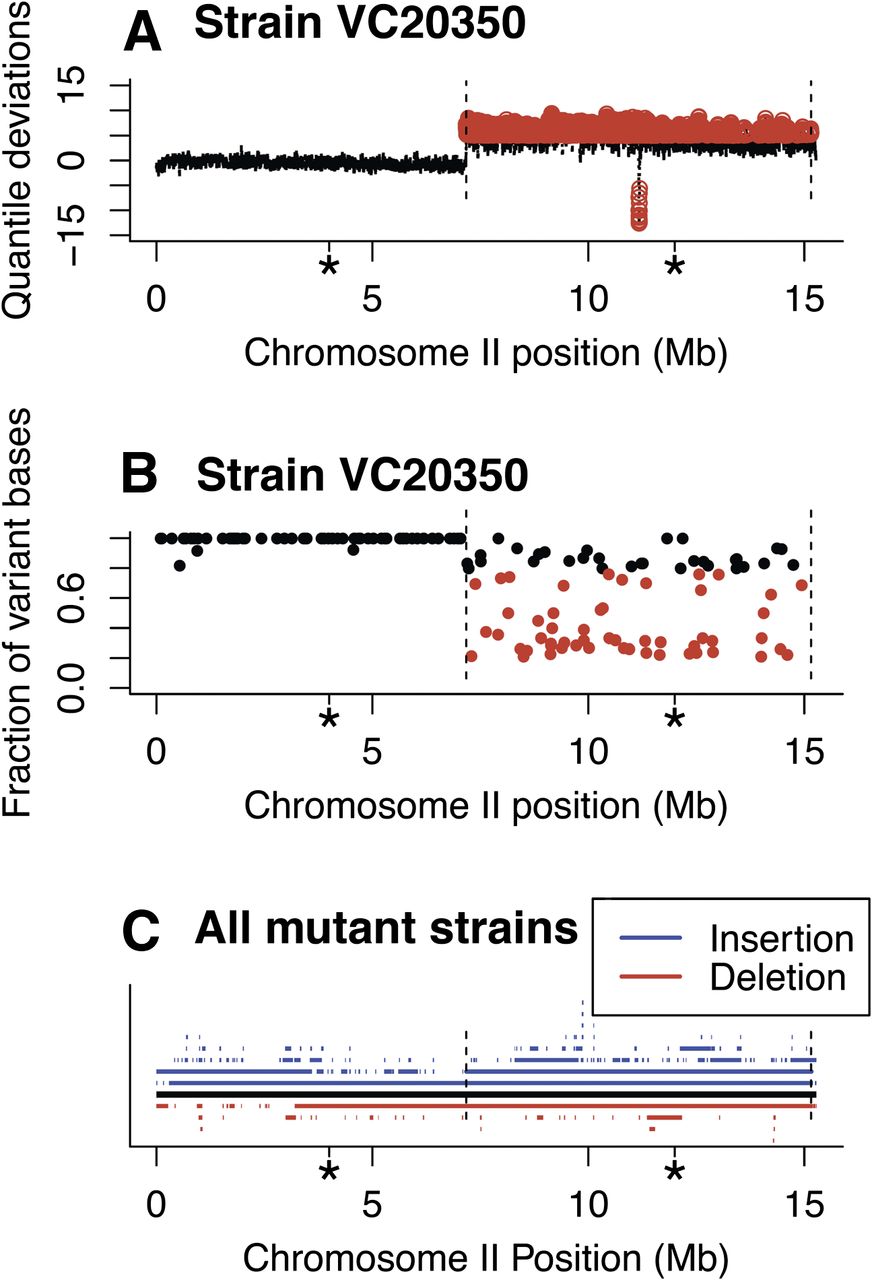
Large duplication and deletion events. (A) A large duplication of the right half of chromosome II and a deletion within that region (red circles) were detected by increased (duplication) or decreased (deletion) read depth (see Methods for details). Dashed vertical lines demark the change from normal copy number. The boundaries of the arms are indicated by the asterisks along the x-axis. (B) The fraction of reads containing a variant base is plotted across chromosome II for the same strain. Although on the left half of the chromosome, SNVs show essentially 100% of the reads with the variant base, in the region of the duplication the fraction drops <80% for most sites, reflecting the heterogeneity of the sites. The underlying event may represent a translocation event (the right end of chromosome I in this strain is also duplicated) maintained because it provides a function lost from a lethal mutation on the normal diploid chromosome. (C) Distribution of duplication (blue) and deletion (red) events on chromosome II in the 2007 mutant strains. Each segment represents a distinct event present in one or more of the strains. The duplication events predominate and both duplications and deletions are broadly distributed across the chromosomes (see Supplemental Fig. 8 for similar plots for all chromosomes).