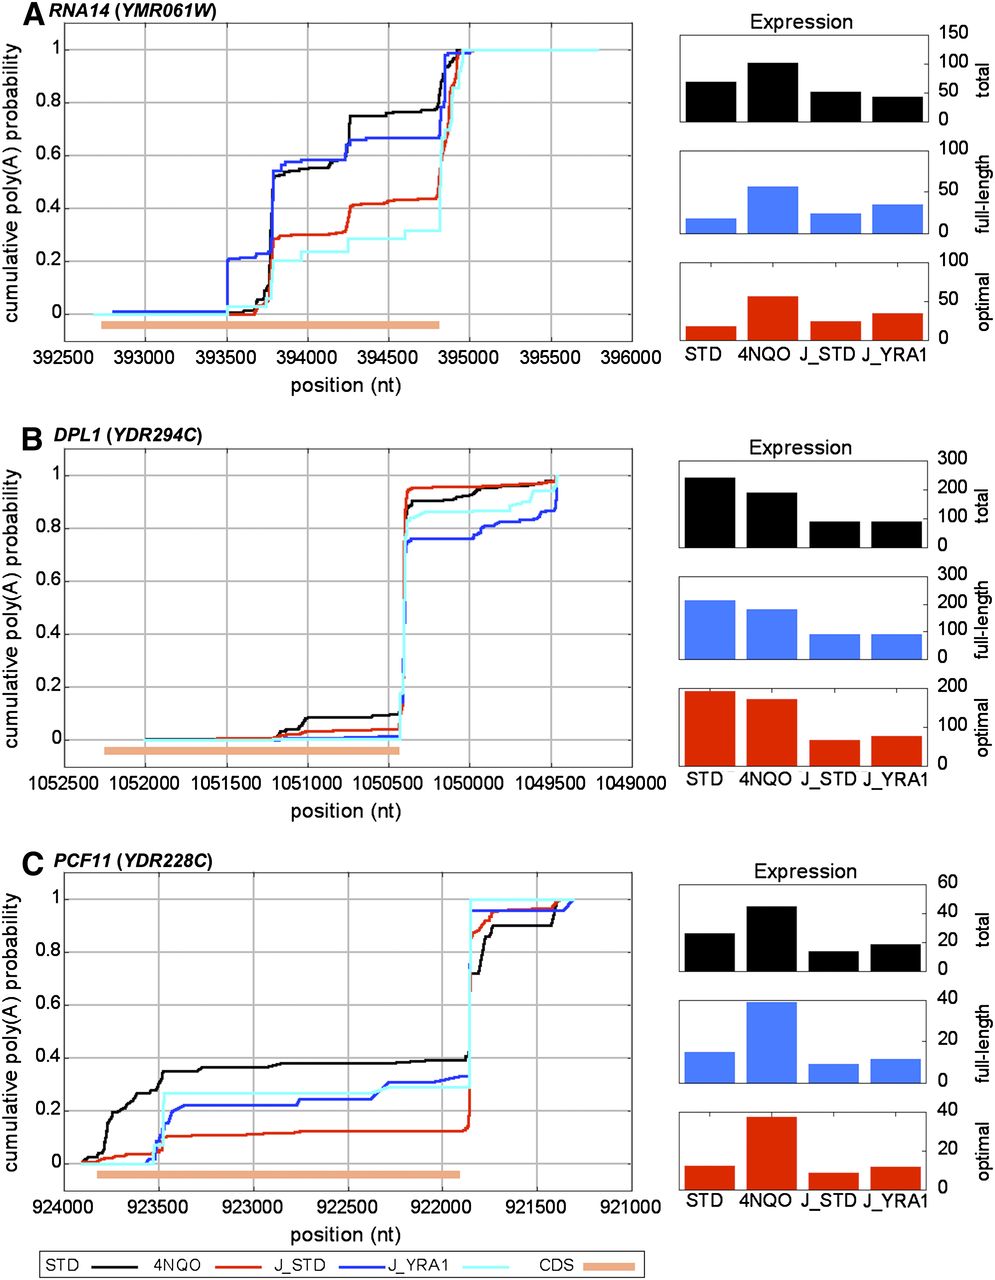
Comparison of poly(A) sets from distinct data sets reveals systematic variations in isoform abundance between experiments. CPD plots comparing the measured differences between the current DRS data and the previously measured poly(A) site profiles for standard and Yra1-depleted conditions (Johnson et al. 2011). (A) RNA14. Transcripts terminating within the RNA14 CDS are significantly suppressed with either exposure to 4NQO or Yra1 depletion; however, the baseline control (STD) plots vary significantly. Note that the putative site positioned ∼393,500 is near an A-rich block, but not close enough to be attributed to internal priming of the oligo-dT. (B) DPL1. No significant variation is measured with either 4NQO exposure or Yra1 depletion; however, significant variation is measured between the two control samples. In addition, the expression levels, shown at right are much more similar within experiments than between control samples of the two experiments (for a genome-wide analysis of expression level similarities , see Supplemental Fig. 8). (C) PCF11. Significant variation was measured in 4NQO but not with Yra1 depletion. As with DPL1, expression levels are more similar between samples in the same experiment than between controls of the distinct experiments. 4NQO, STD data from the current study. J_STD (control) and J_YRA1 (Yra1-depleted) samples from Johnson et al. (2011).