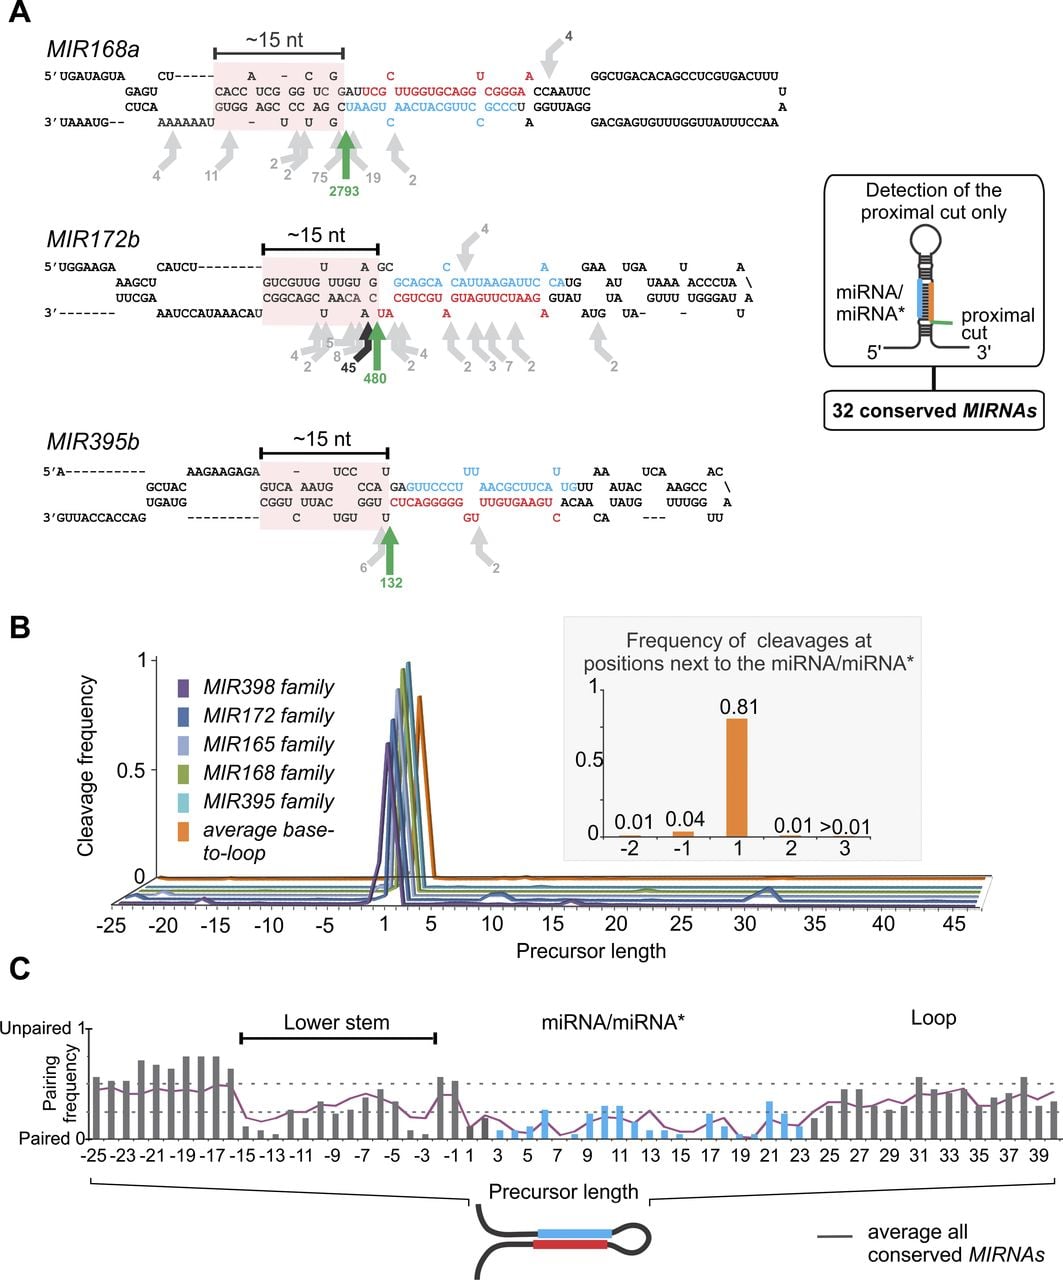
Identification and characterization of miRNA precursors processed in a base-to-loop direction. (A) Scheme showing the secondary structure of MIR168a, MIR172b, and MIR395b. The arrows indicate the positions and number of reads of the precursor cuts identified. Green arrows show the most abundant cleavage site detected, which also corresponds to the proximal site of the miRNA/miRNA*. Black arrows show other cleavage sites of at least 5% abundance of the total reads, while other minor cuts are shown in gray. A lower stem structured region of ∼15 nt below the proximal cut is highlighted with a pink box. The miRNAs are indicated in red and the miRNAs* in blue. The inset on the right shows the typical cleavage pattern detected in the SPARE library for these precursors. (B) Distribution of cuts along the precursor sequence for specific miRNA families and all conserved miRNAs detected as being processed in a base-to-loop direction. The proximal side of the miRNA/miRNA* is defined as +1. The inset shows the frequency of cuts at the proximal site of the miRNA/miRNA* and the two positions next to it. (C) Secondary structure of the precursors detected to be processed in a base-to-loop direction. The structures were obtained from mfold (Zuker 2003; http://www.bioinfo.rpi.edu/applications/mfold/), and the matches in each position were considered as 0, while bulges and mismatches were considered as 1. The secondary structure considering all conserved miRNAs is indicated as a purple line.