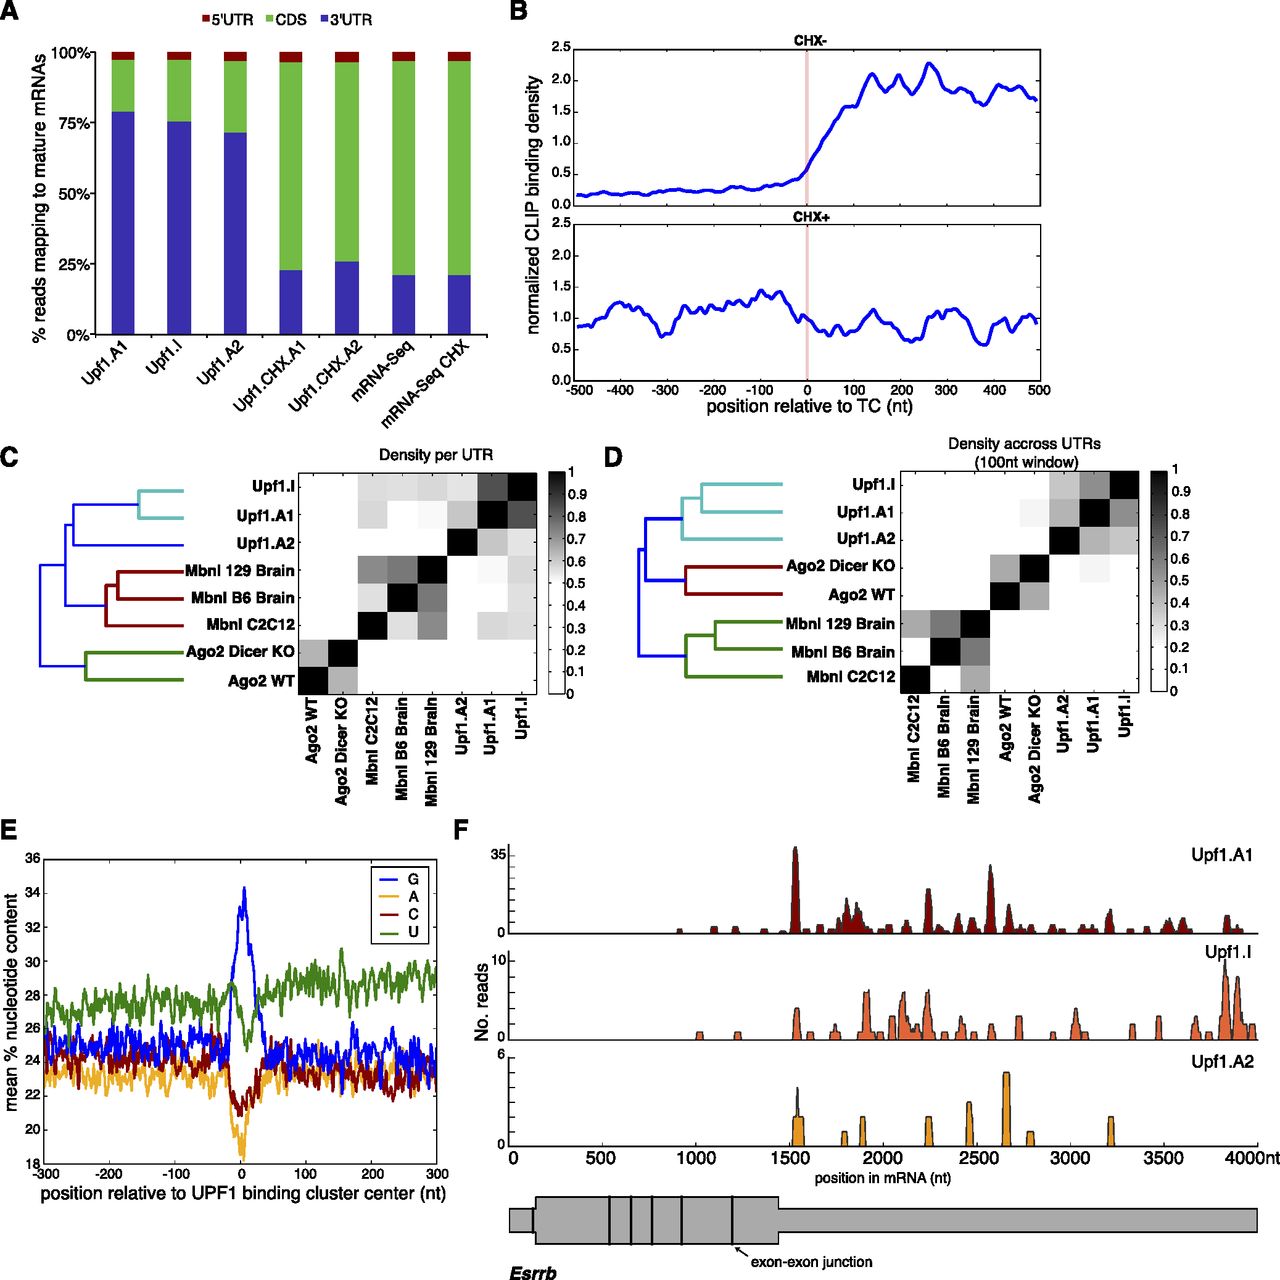
UPF1 interacts predominantly with 3′ UTRs of mature mRNAs. (A) Distribution of CLIP-seq reads mapping to 5′ UTRs, coding sequences (CDS), and 3′ UTRs using RNase A (“A”) or RNase I (“I”) and RNA-seq reads, from control and CHX+ treatments. (B) Metagene plot of average UPF1 CLIP tag density per gene in 500-nt regions flanking the TC (red line) under normal (top) and CHX (bottom) conditions. Density was smoothed using a Gaussian with standard deviation of 10 nt. (C,D) Correlation of UPF1 CLIP samples binding in 3′ UTRs of genes with minimum FPKM (fragments per kilobase per million mapped reads) of 50. Correlations of MBNL1 CLIP data in mouse C2C12 cells and two mouse brain samples (Wang et al. 2012) and of AGO2 CLIP data in wild-type and Dicer null mESCs (Leung et al. 2011) are shown for comparison. In C, correlation coefficients were calculated between densities of CLIP binding over all UTRs. In D, correlation coefficients were calculated between densities over 100-nt windows across all UTRs. Grayscale emphasizes higher values in C. (E) Mean nucleotide content flanking UPF1 binding sites within 3′ UTRs. Lines indicate moving average of values for each nucleotide using a 3-bp sliding window. (F) UPF1 binding to the Esrrb mRNA in three CLIP experiments in untreated cells. Schematic of Esrrb mature mRNA displayed below. Width of gray bar indicates CDS and UTR regions, and vertical black bars indicate exon-exon junctions.