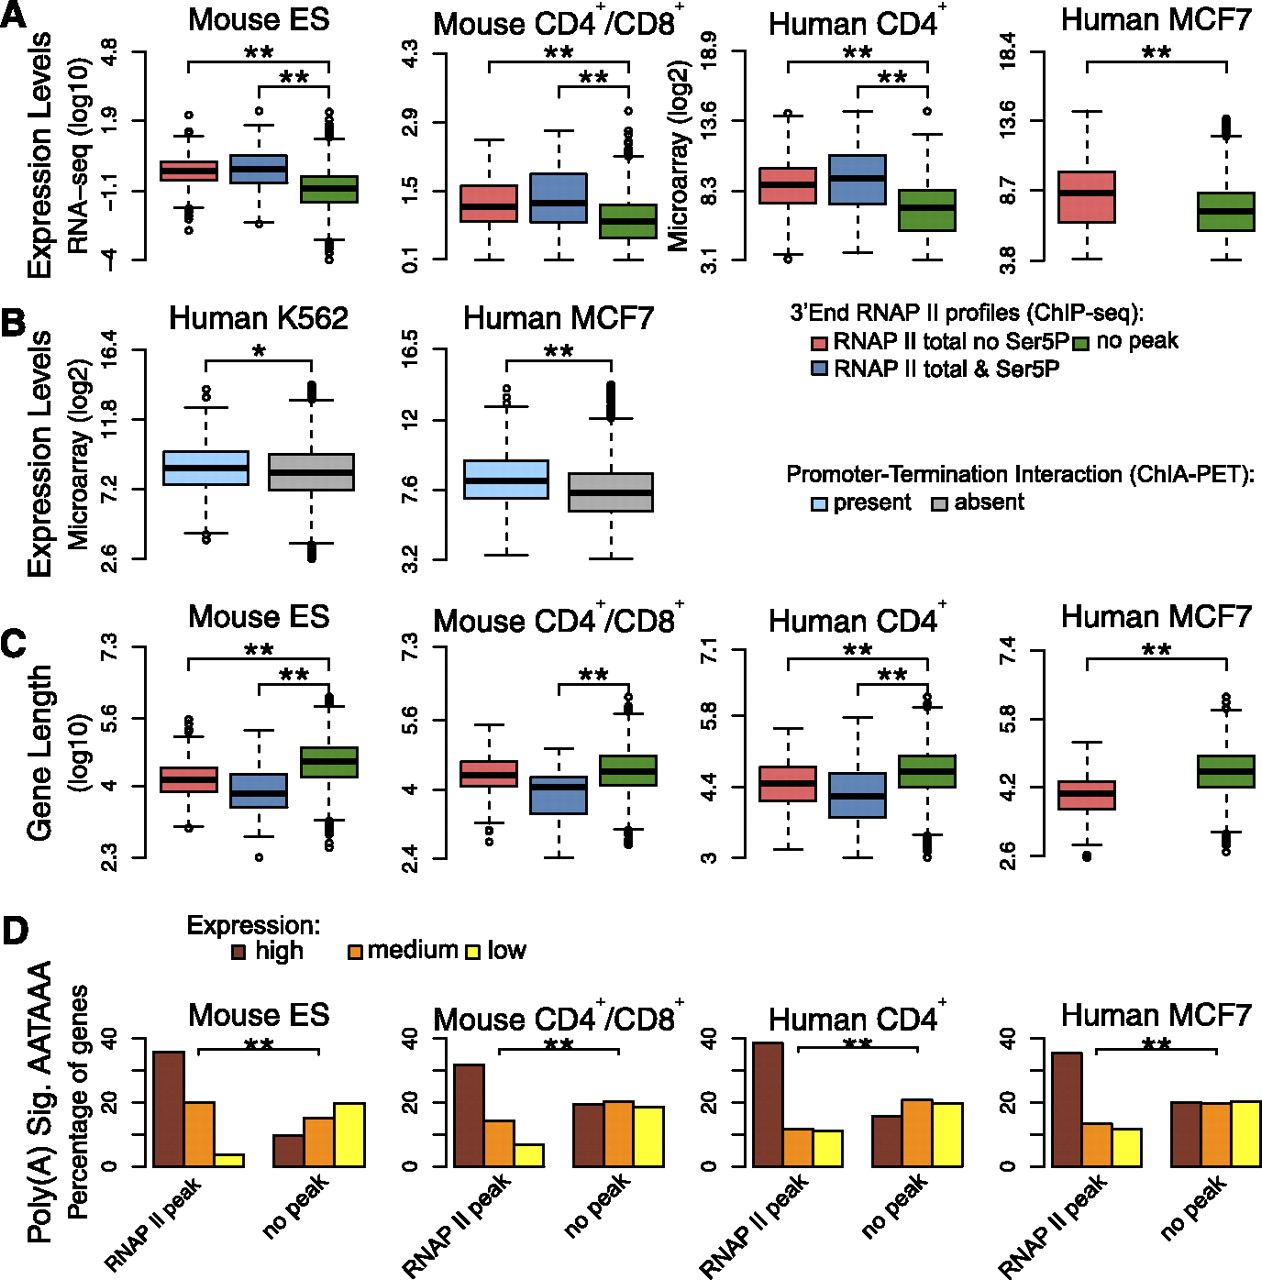
Genes with and without 3′ peaks of RNAPII have distinctive features. (A) Comparison of expression levels in genes that are devoid of any peak of total RNAPII at the 3′-end (green); genes with a 3′ peak of total RNAPII that is not phosphorylated on Ser5 (red); and genes with a 3′ peak of total RNAPII that is phosphorylated on Ser5 (blue). Gene expression levels were estimated according to RNA-seq (Mouse ES and CD4+/CD8+ cells) and microarray data (human CD4+ T and MCF7 cells). (B) Comparison of expression levels in genes with and without interactions between the promoter and termination region identified by ChIA-PET. Gene expression levels were estimated according to microarray data. (C) Comparison of gene length in the indicated categories. (*) P-value <0.05; (**) P-value <0.0005 by two-sided Mann-Whitney test. (D) Frequency of poly(A) signal AATAAA in genes that either contain a 3′ peak of total RNAPII or are devoid of peak. Genes were split into three equally sized groups according to expression level (high, medium, and low). (**) P-value <0.0005 by χ2 test. In boxplots, values inside each box correspond to the middle 50% of the data and the line within the box represents the median; the ends of the vertical lines at the top and bottom of each box indicate the maximum and minimum limits of the distribution; values behind the lines (circles) are suspected outliers.