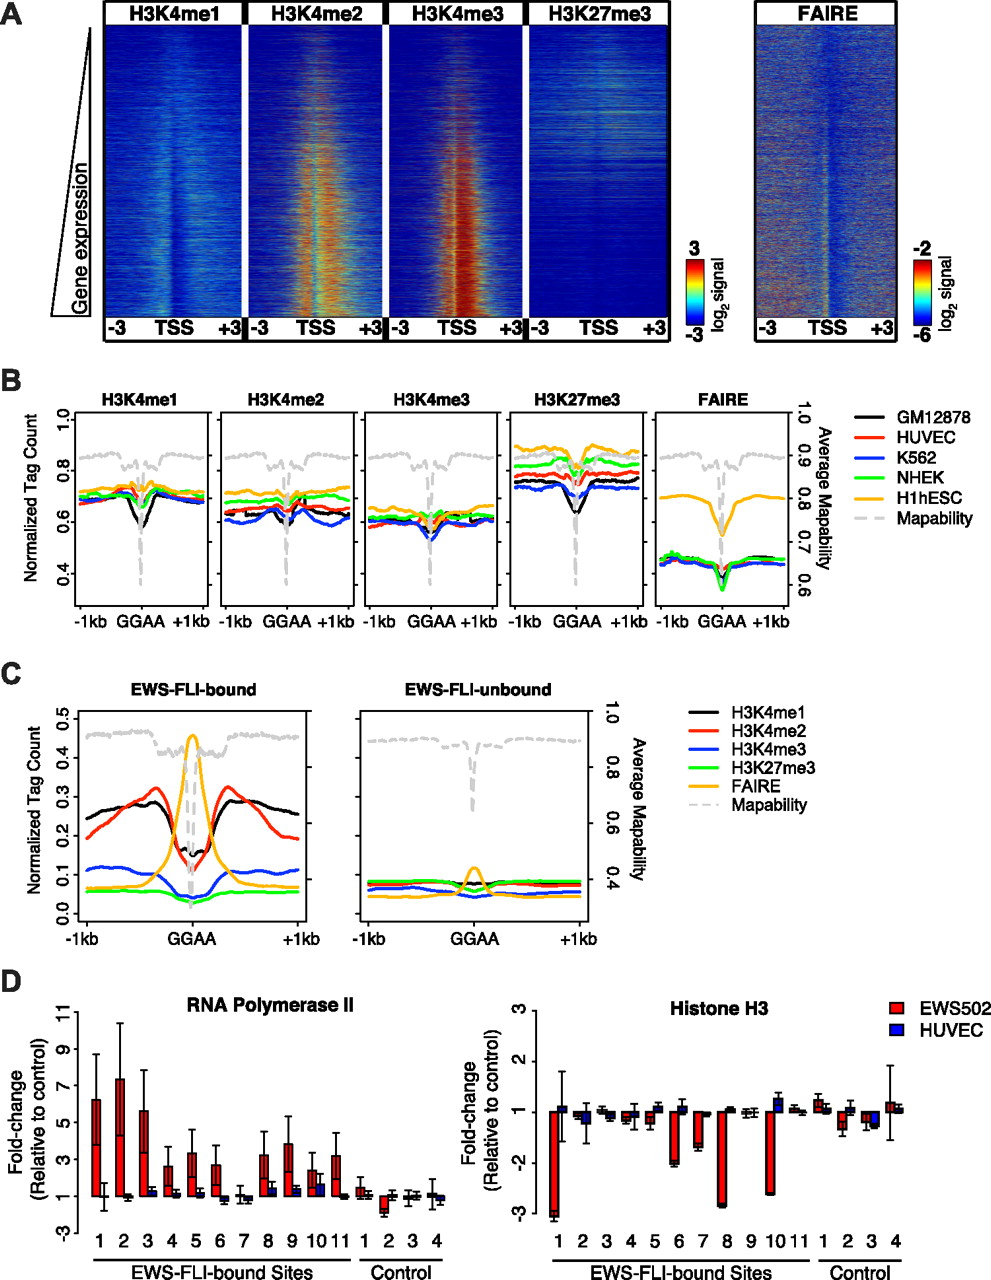
Deregulation of repetitive elements in Ewing Sarcoma. (A) Heatmap of normalized ChIP and FAIRE signal ±3 kb around TSS ranked by gene expression in Ewing cells. Color was assigned on a log2 scale of −3 to 3 for ChIP and −6 to −2 for FAIRE. (B) Normalized ChIP and FAIRE signals around the centers of GGAA repeats in five ENCODE cell lines (GM12878, black; HUVEC, red; K562, blue; NHEK, green; H1hESC, orange). Mapability of the underlying DNA sequence is represented on a scale of 0 (ambiguous) to 1 (unique) and is plotted in gray. (C) Normalized ChIP and FAIRE signals around the centers of EWS–FLI-bound (left) or -unbound (right) GGAA repeats in Ewing Sarcoma cells. Mapability of the underlying DNA sequence is represented on a scale of 0 (ambiguous) to 1 (unique) and is plotted in gray. (D) Enrichment of EWS–FLI-bound GGAA repeats for RNA polymerase II (left) and histone H3 (right) in Ewing cells (red) and HUVEC (blue), as assayed by ChIP–qPCR. All values are represented as the fold-change relative to the average of the negative controls; fold-change values are centered on 1. Error bars represent the standard error from three technical replicates.