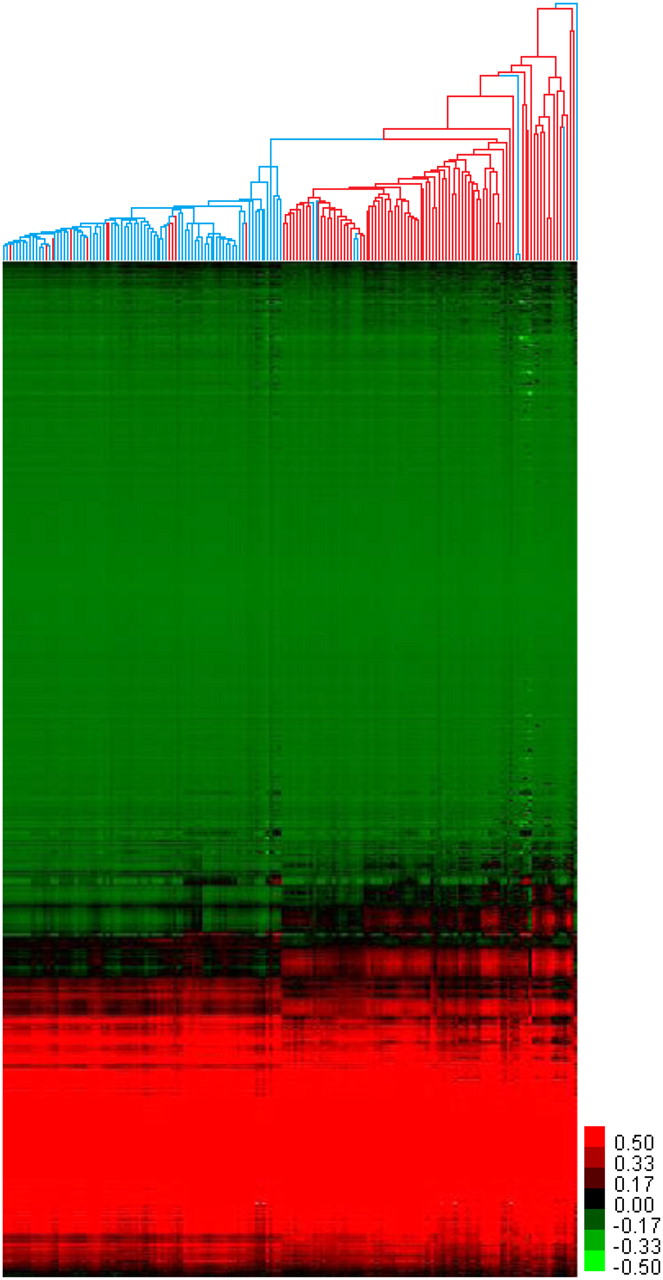
Figure 1.
Hierarchical clustering of prostate tissues by DNA methylation. Unsupervised hierarchical clustering of 181 prostate tissues and 26,333 CpGs, by sample and by CpG. (Red branches) Tumor samples; (blue branches) benign adjacent samples; (red pixels) high DNA methylation; (green pixels) low DNA methylation.