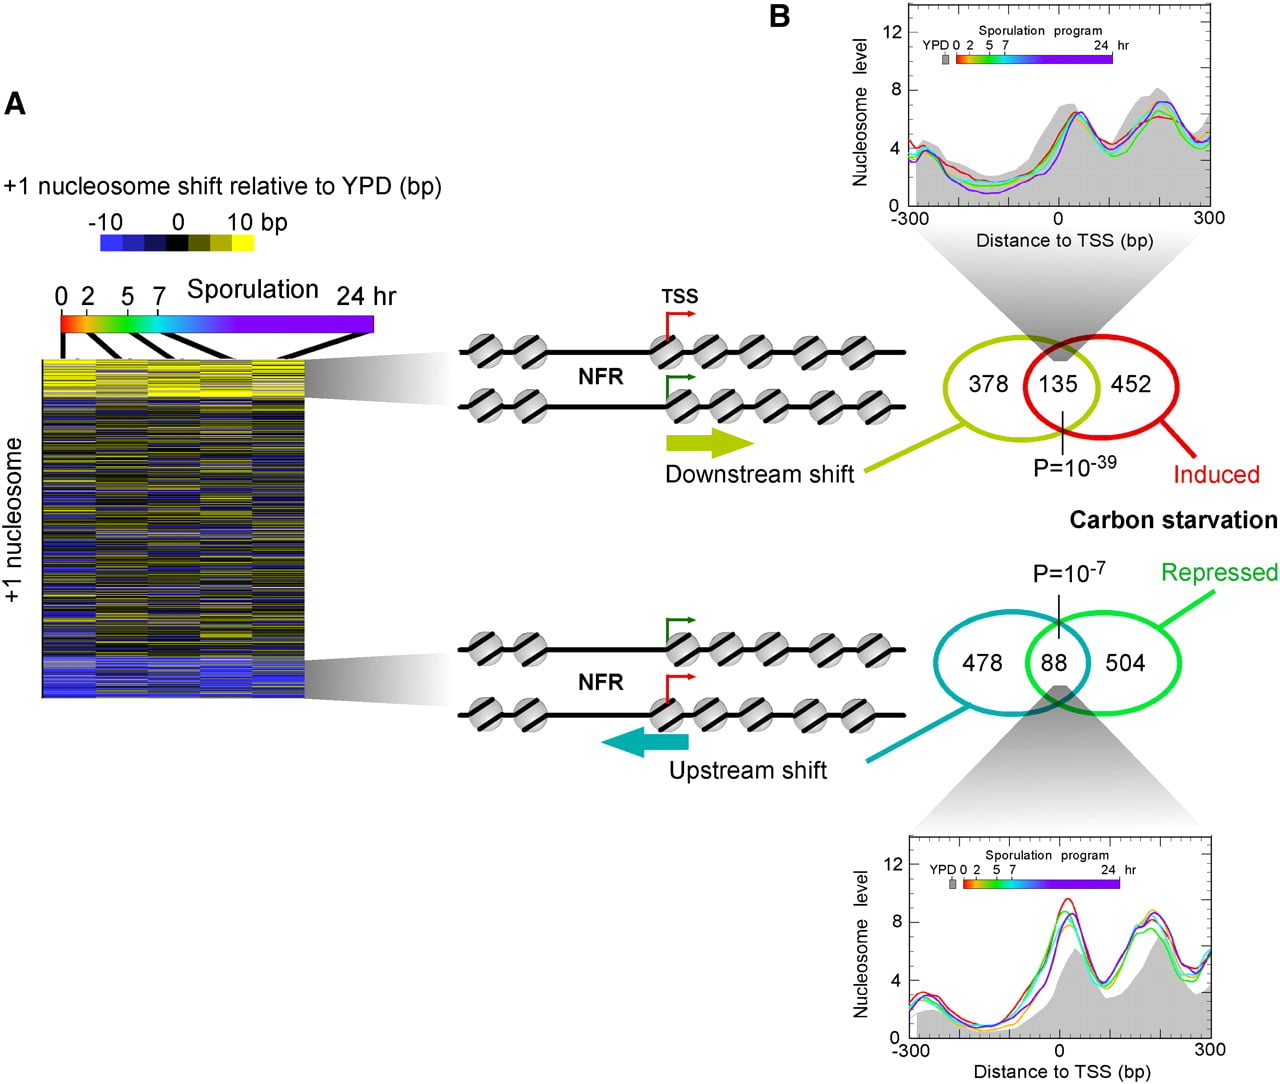
+1 nucleosome shift is linked with carbon starvation regulation. (A) +1 nucleosome midpoint distances from the position found in YPD were calculated for each gene (rows) at all time points (columns) and displayed as a cluster plot. Three distinct groups were identified by k-means clustering. Distances shifted downstream in a positive direction are color-coded yellow. Upstream shifts are colored blue. Equivalent shifts were evident across the genic nucleosomal arrays. (B) Venn diagram and χ-test are shown for the overlap of the indicated cluster of genes and those genes most up- or down-regulated (as indicated) upon carbon starvation (Bradley et al. 2009). Composite nucleosome distributions around the TSS are shown for the set of intersecting genes.