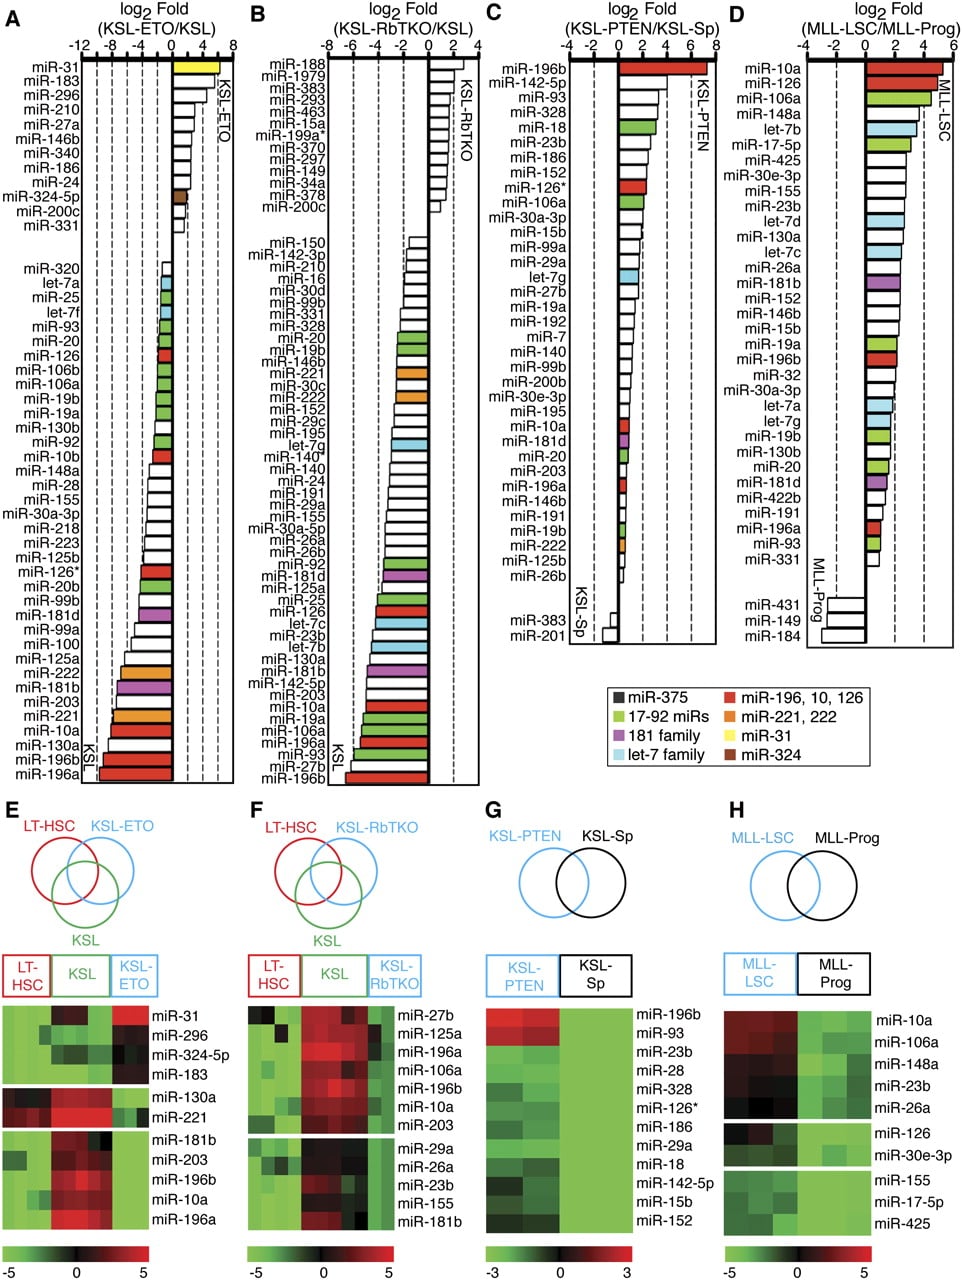
Figure 5.
Dysregulation of miRNA programs by genetic mutations altering the functional properties of stem/progenitor cells. Global changes of miRNA expression in mutant stem and progenitor cells: (A) KSL-ETO, (B) KSL-RbTKO, (C) KSL-PTEN, and (D) MLL-LSC. miRNAs that are significantly different between mutant cells and their control cells (SAM, FDR < 0.001) are shown as fold of changes (Log2 Fold Mutant/Control). Heatmaps depict the specific miRNA clusters that were turned on/off in mutant stem and/or progenitor cells: (E) KSL-ETO; (F) KSL-RbTKO; (G) KSL-PTEN; and (H) MLL-LSC. False color scales were used to indicate normalized expression intensity.