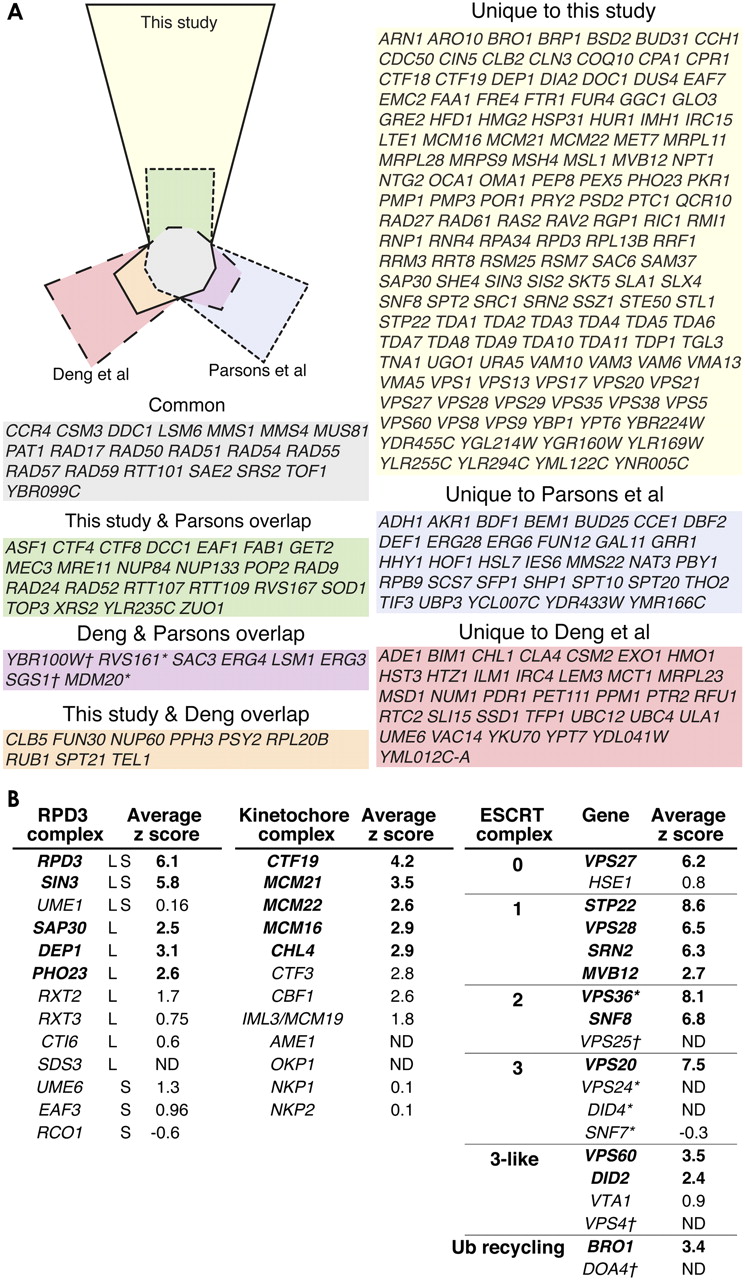
Area-proportional Euler diagram comparing three different screens for gene disruptions sensitive to Top1-induced DNA damage. (A) The Euler diagram (left) shows irregular polygons with areas proportional to the numbers of genes identified in three different screens. The solid outline represents genes identified in the current study. The dashed line represents the genes identified in the Deng et al. (2005) CPT screen. The dotted line indicates the genes identified in the Parsons et al. (2004) screen. The proportion of genes unique to each screen is shown as the parts of those polygons in primary colors (yellow for this study; red for Deng et al. 2005; blue for Parsons et al. 2004). Where two screens overlap, the section is indicated by a secondary color. Genes found in all three screens are shown in the middle in gray. The colored boxes on the right list the genes that populate each section of the diagram. The Euler diagram was drawn using the “Draw Euler” applet by Stirling Chow (http://theory.cs.uvic.ca/euler/DrawEuler/). (B) Three complexes identified as unique to the top1-T722A screens are listed with average Z-scores. Bold indicates Z-scores > 2 in both screens. Genes with Z-scores > 2 that are not in bold indicate a Z-score below the cutoff in one of the screens. (ND) A log ratio could not be derived for the gene due to slow growth with the control plasmid. (†) Deletions strains identified as top1-T722A sensitive in the manual-pin screen. (*) The deletion strain was individually grown after transformation and tested to show top1-T722A sensitivity.