Figure 2.
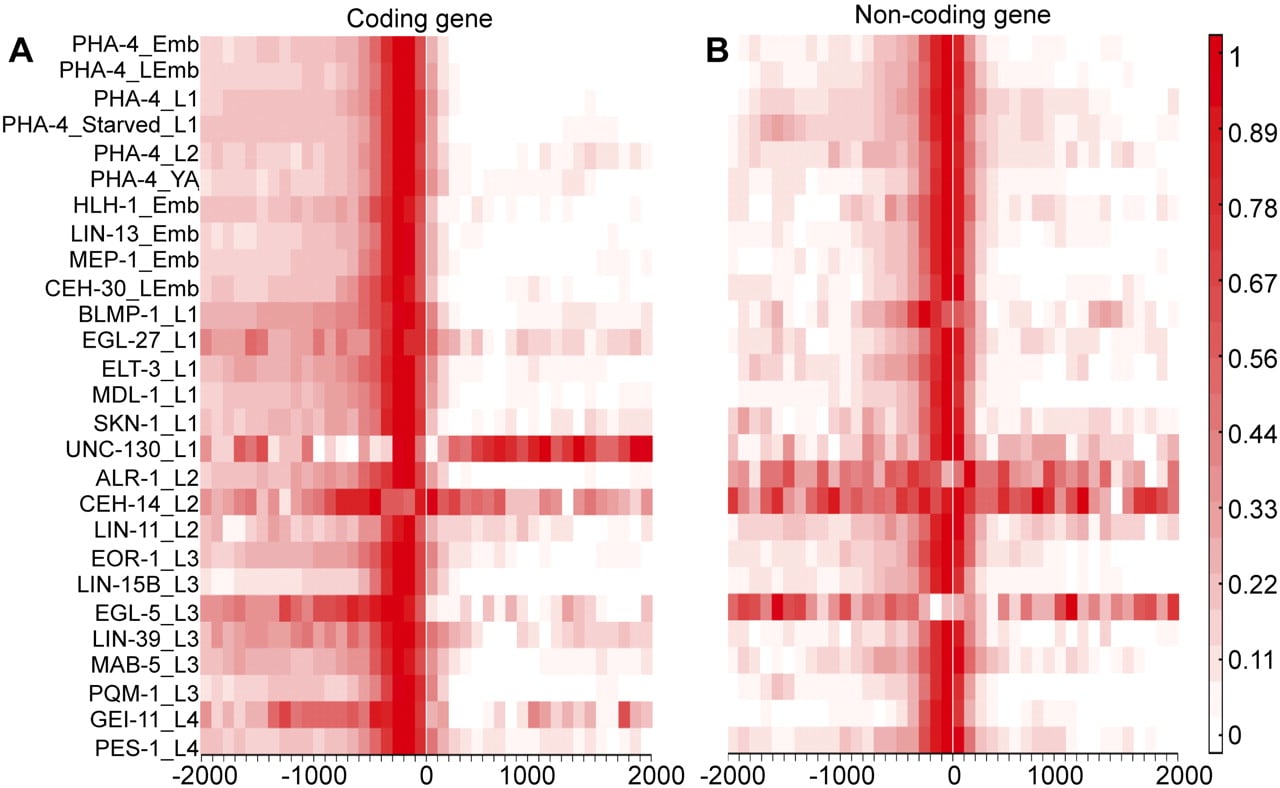
Analysis of gene targets for 22 transcription factors. (A,B) Heat map showing the distribution of binding relative to the TSS (“0”) for each factor for coding (A) and non-coding (B) gene targets.
Analysis of gene targets for 22 transcription factors. (A,B) Heat map showing the distribution of binding relative to the TSS (“0”) for each factor for coding (A) and non-coding (B) gene targets.