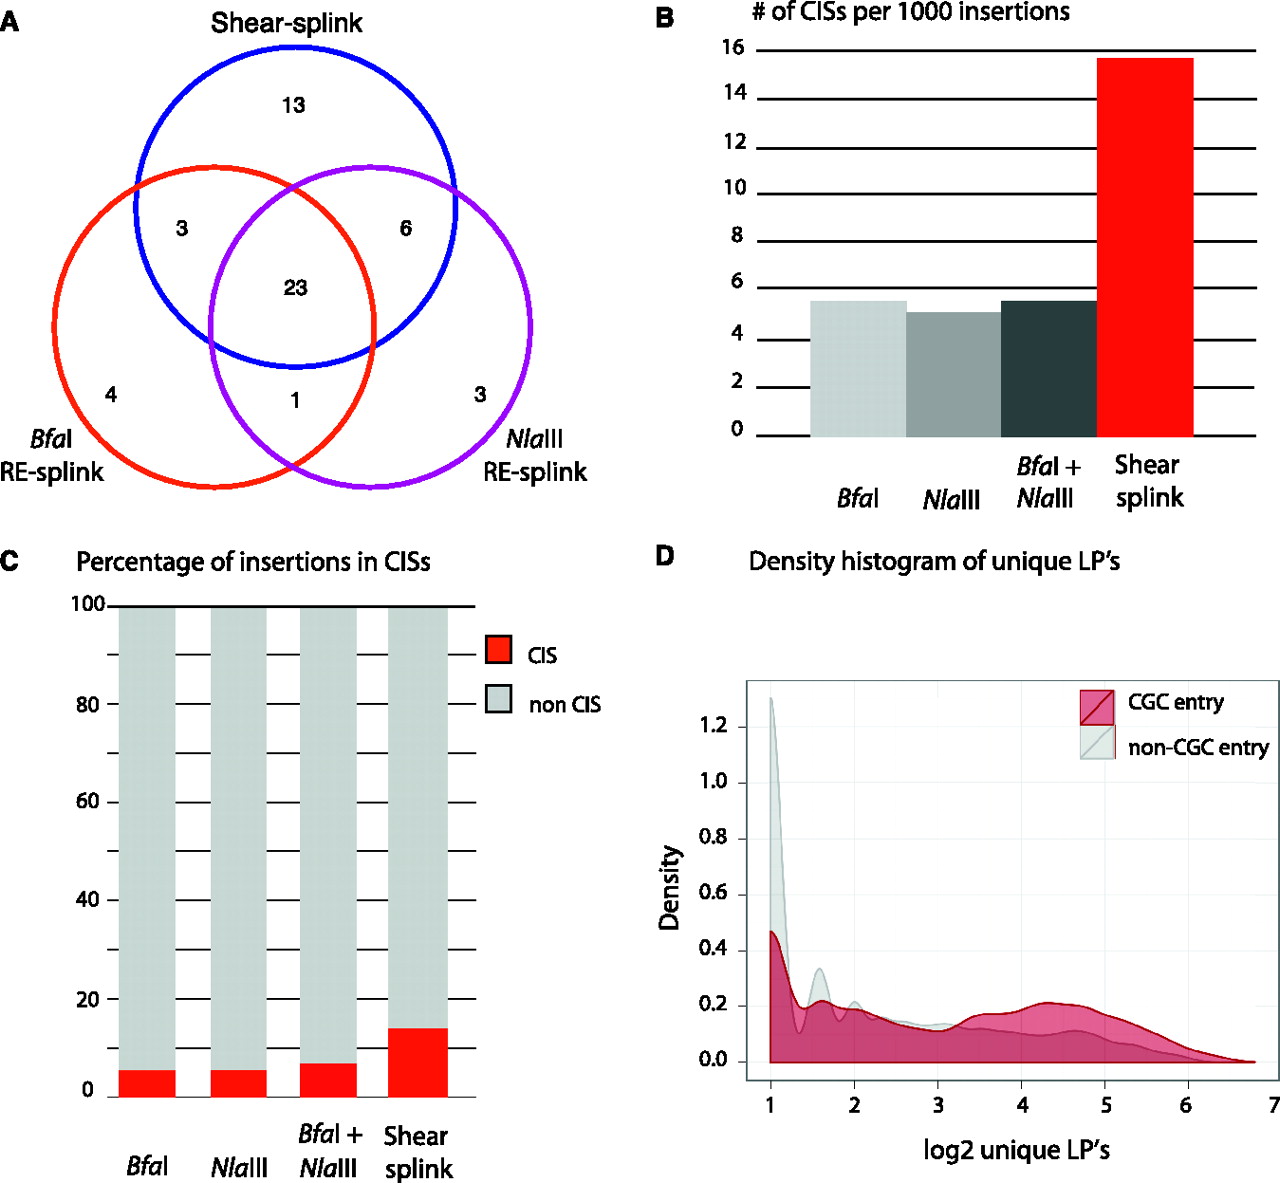
Analysis of insertions in Sleeping Beauty–induced lymphomas by shear-splink and RE-splink. (A) Venn diagram showing the overlap of CISs in 127 Sleeping Beauty–induced lymphomas, as identified by shear-splink and RE-splink using BfaI or NlaIII . In total, 53 CISs are identified. Shear-splink detected more CISs (45) than BfaI- and NlaIII-based RE-splink (31 and 33 CISs, respectively). (B) Shear-splink enriches for insertions contributing to CISs, as shown for the number of CISs identified per 1000 insertions. Combining both RE-splink data sets does not increase the efficiency, since the number of CISs per 1000 insertions is similar to the individual RE-splink analysis. (C) The percentage of insertions contributing to a CIS is higher for shear-splink than for the individual or combined RE-splink datasets, confirming that shear-splink enriches for relevant insertions. (D) Insertions near cancer-related genes are represented by higher numbers of unique LPs. Density plot showing the distribution of unique LPs for SB insertions neighboring a Cancer Genome Census (CGC) gene (red) vs. those not flanking a CGC gene (gray).