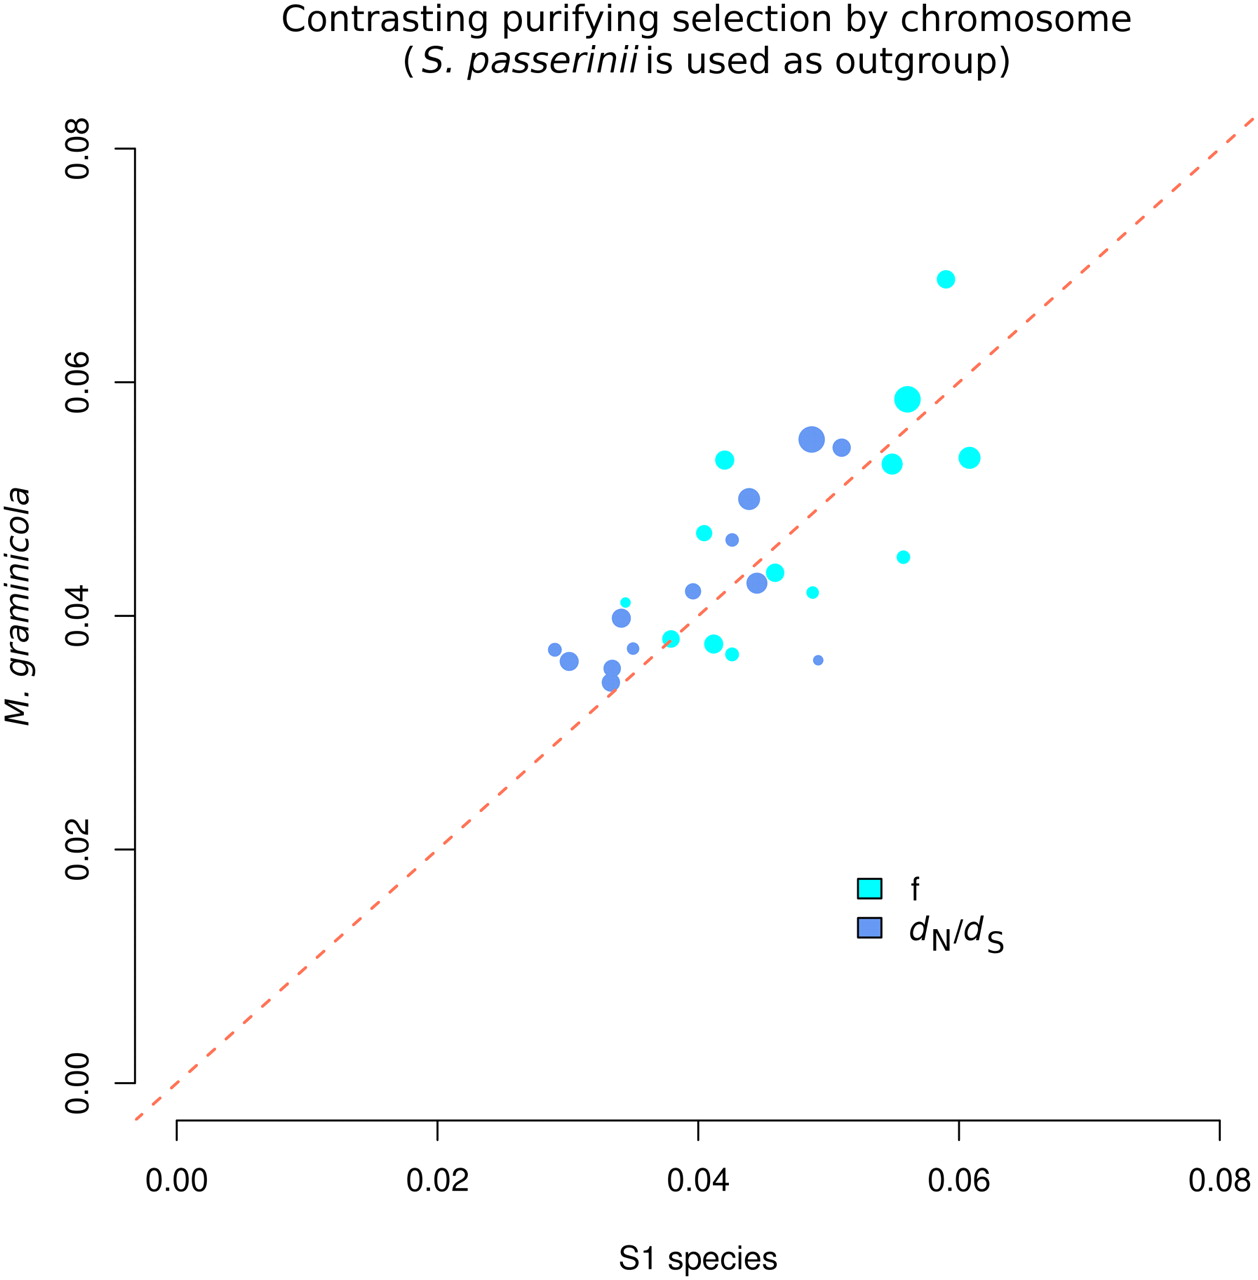
Figure 3.
Contrasting evolutionary rates on the M. graminicola and S1 branches of the phylogeny. Plotted is dN/dS in M. graminicola versus S1 (blue dots) and the parameter “f” (green dots) showing the fraction of nonsynonymous mutations experiencing strong purifying selection as a measure of purifying selection in the two species. Each dot represents the average measure of a chromosome, and the size of the dot corresponds to the relative sizes of the different chromosomes (on a log scale). While dN/dS is significantly higher in M. graminicola, the strength of purifying selection is highly similar in the two species. S. passerinii is used as the outgroup in both analyses.