Table 1.
High MaxC and high SD enrich MIC genes
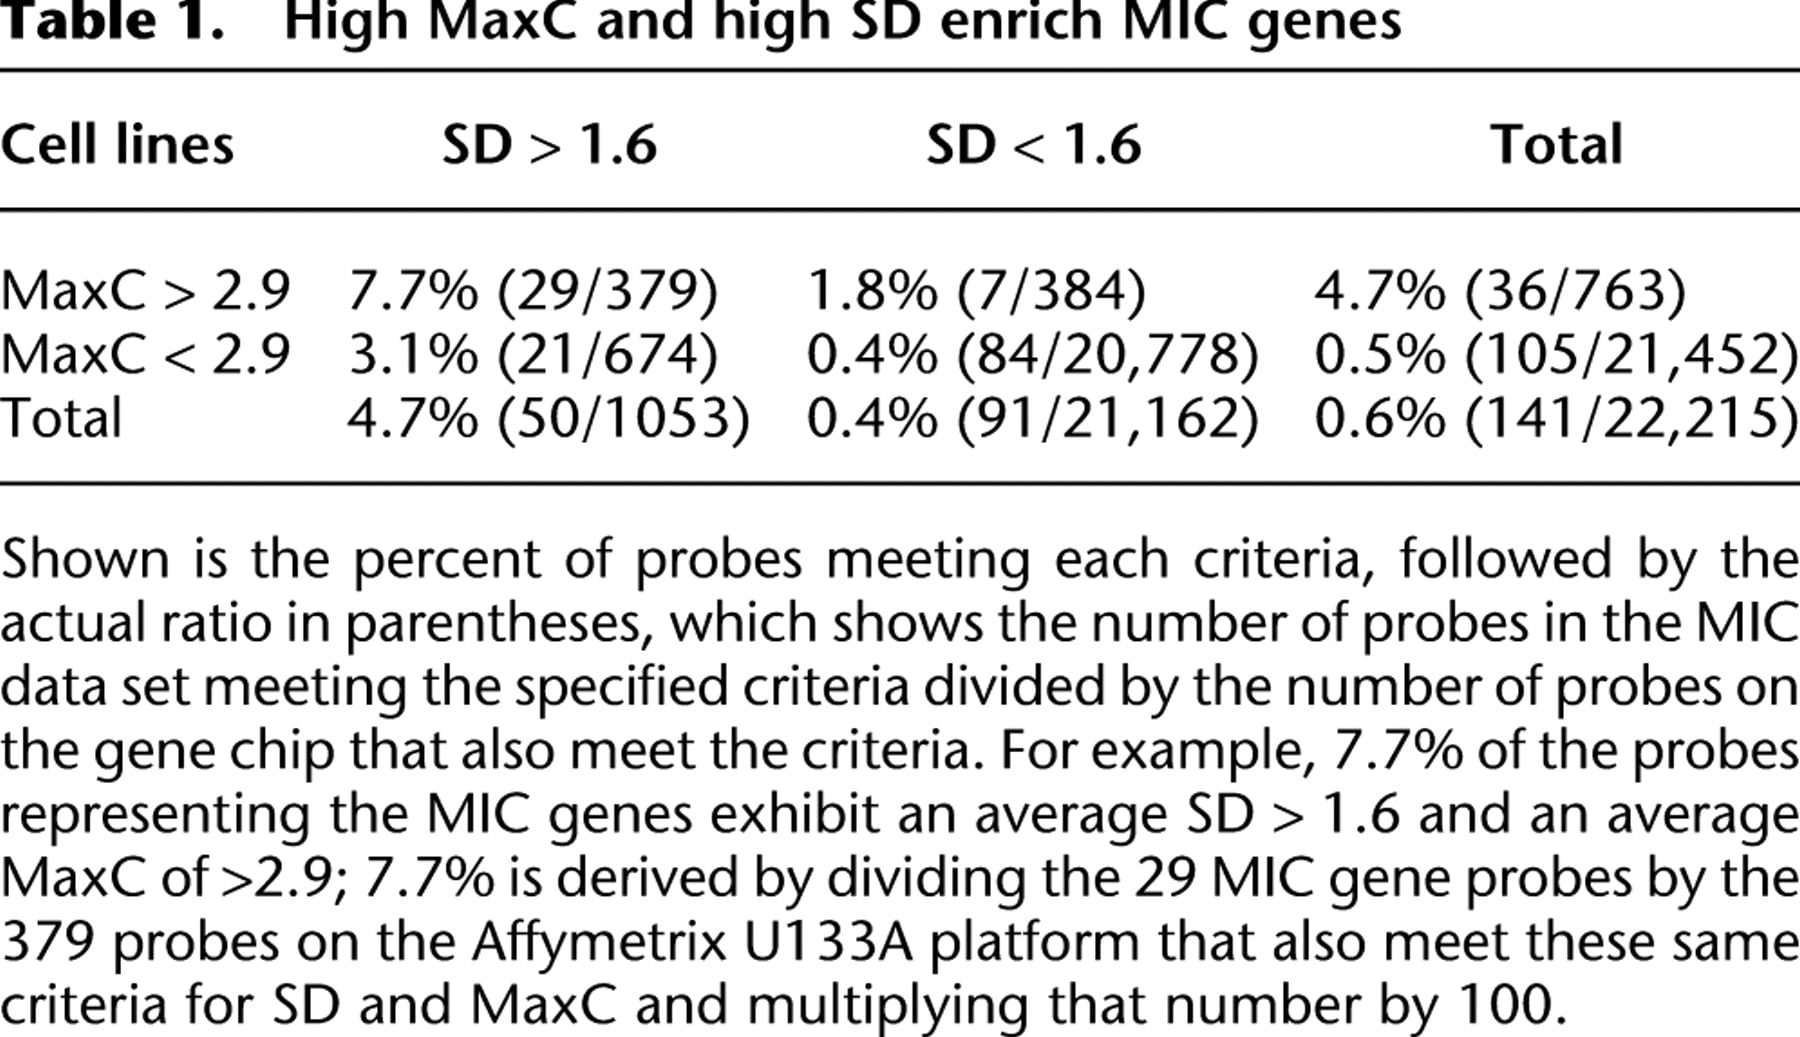
[i] Shown is the percent of probes meeting each criteria, followed by the actual ratio in parentheses, which shows the number of probes in the MIC data set meeting the specified criteria divided by the number of probes on the gene chip that also meet the criteria. For example, 7.7% of the probes representing the MIC genes exhibit an average SD > 1.6 and an average MaxC of >2.9; 7.7% is derived by dividing the 29 MIC gene probes by the 379 probes on the Affymetrix U133A platform that also meet these same criteria for SD and MaxC and multiplying that number by 100.