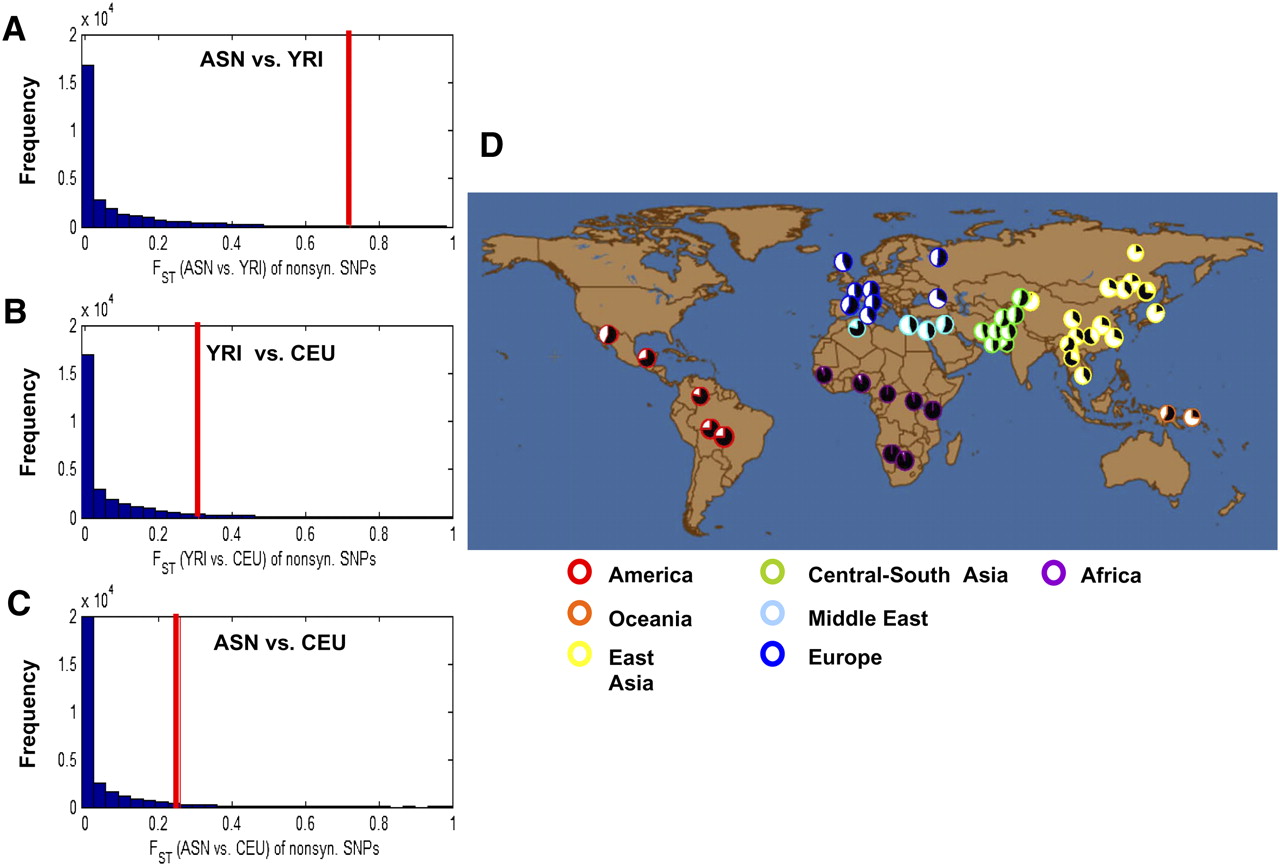
Differential distribution of alleles at rs2291725 in human populations. (A–C) The distribution of the FST for nonsynonymous SNPs across the human genome and the FST for rs2291725. FST estimations between ASN and YRI (A), YRI and CEU (B), and ASN and CEU (C) are shown in the x-axis. The red vertical bar indicates the corresponding values of FST for rs2291725. The y-axis represents the frequency of SNPs with a given FST estimate. Statistical significance for comparisons in A, B, and C is indicated with empirical P = 0.0039, 0.058, and 0.047, respectively. The number of coding SNPs that were analyzed in the A, B, and C histograms was 48,526, 48,674, and 48,075, respectively. Among these SNPs, the number of nonsynonymous SNPs in the A, B, and C histograms was 29,033, 29,026, and 28,774, respectively. (D) Distribution of rs2291725 in the HGDP–CEPH (944 unrelated samples) populations. Pie charts represent the proportion of each genotype by geographic region. The ancestral GIP103T allele (black pie) occurs at a higher frequency in African and American populations, whereas the majority of Eurasian populations have a higher frequency of the derived GIP103C allele (white pie).