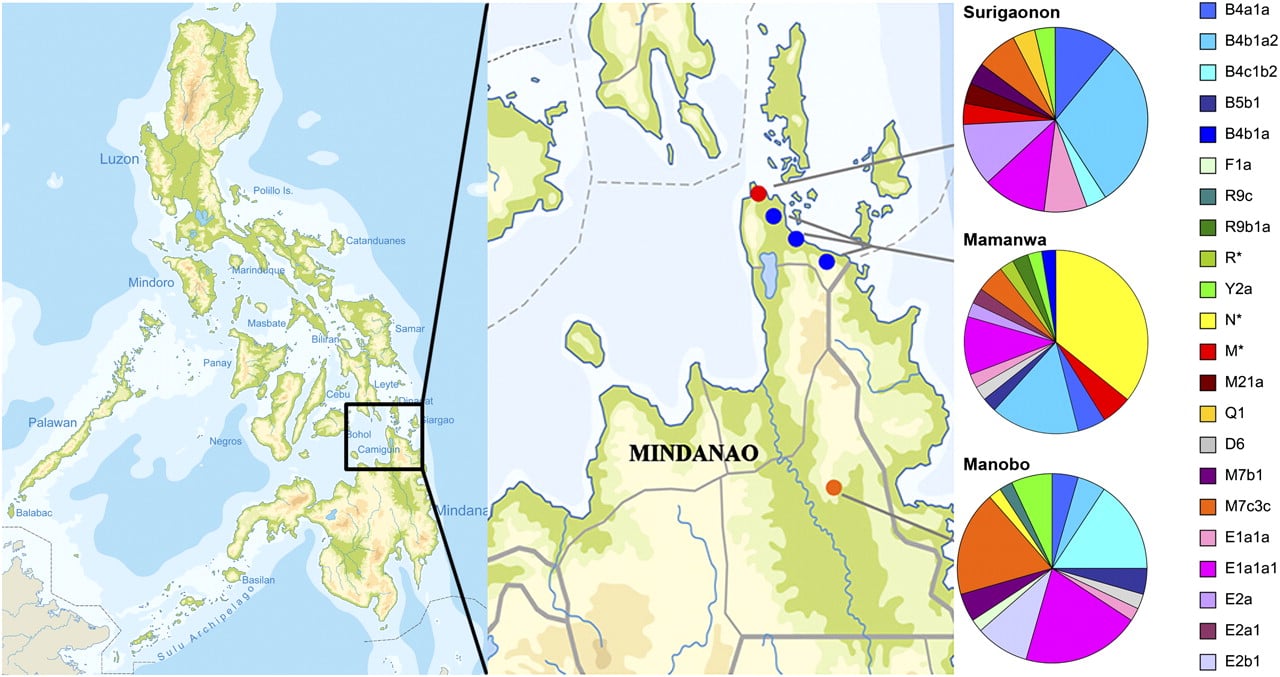
Map of sampling locations, and mtDNA haplogroup frequencies, for the three Filipino groups in this study.