Expression differences between males from the fertile (f) and sterile (s) introgression lines
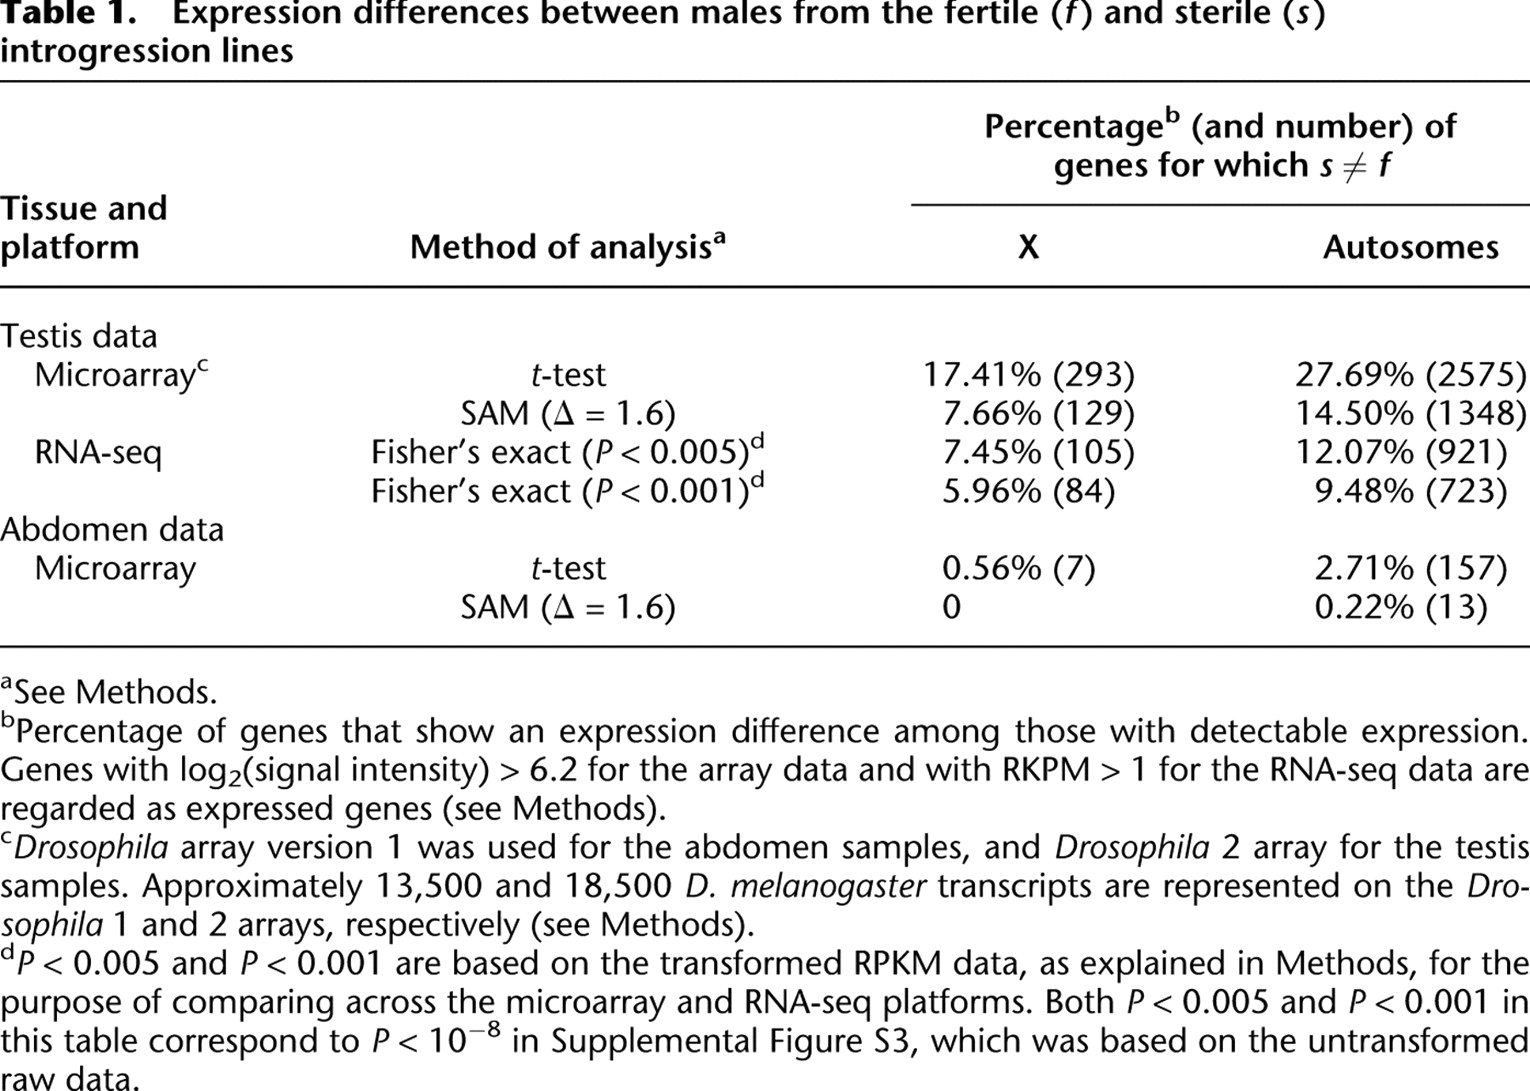
[i] aSee Methods.
[ii] bPercentage of genes that show an expression difference among those with detectable expression. Genes with log2(signal intensity) > 6.2 for the array data and with RKPM > 1 for the RNA-seq data are regarded as expressed genes (see Methods).
[iii] cDrosophila array version 1 was used for the abdomen samples, and Drosophila 2 array for the testis samples. Approximately 13,500 and 18,500 D. melanogaster transcripts are represented on the Drosophila 1 and 2 arrays, respectively (see Methods).
[iv] dP < 0.005 and P < 0.001 are based on the transformed RPKM data, as explained in Methods, for the purpose of comparing across the microarray and RNA-seq platforms. Both P < 0.005 and P < 0.001 in this table correspond to P < 10−8 in Supplemental Figure S3, which was based on the untransformed raw data.