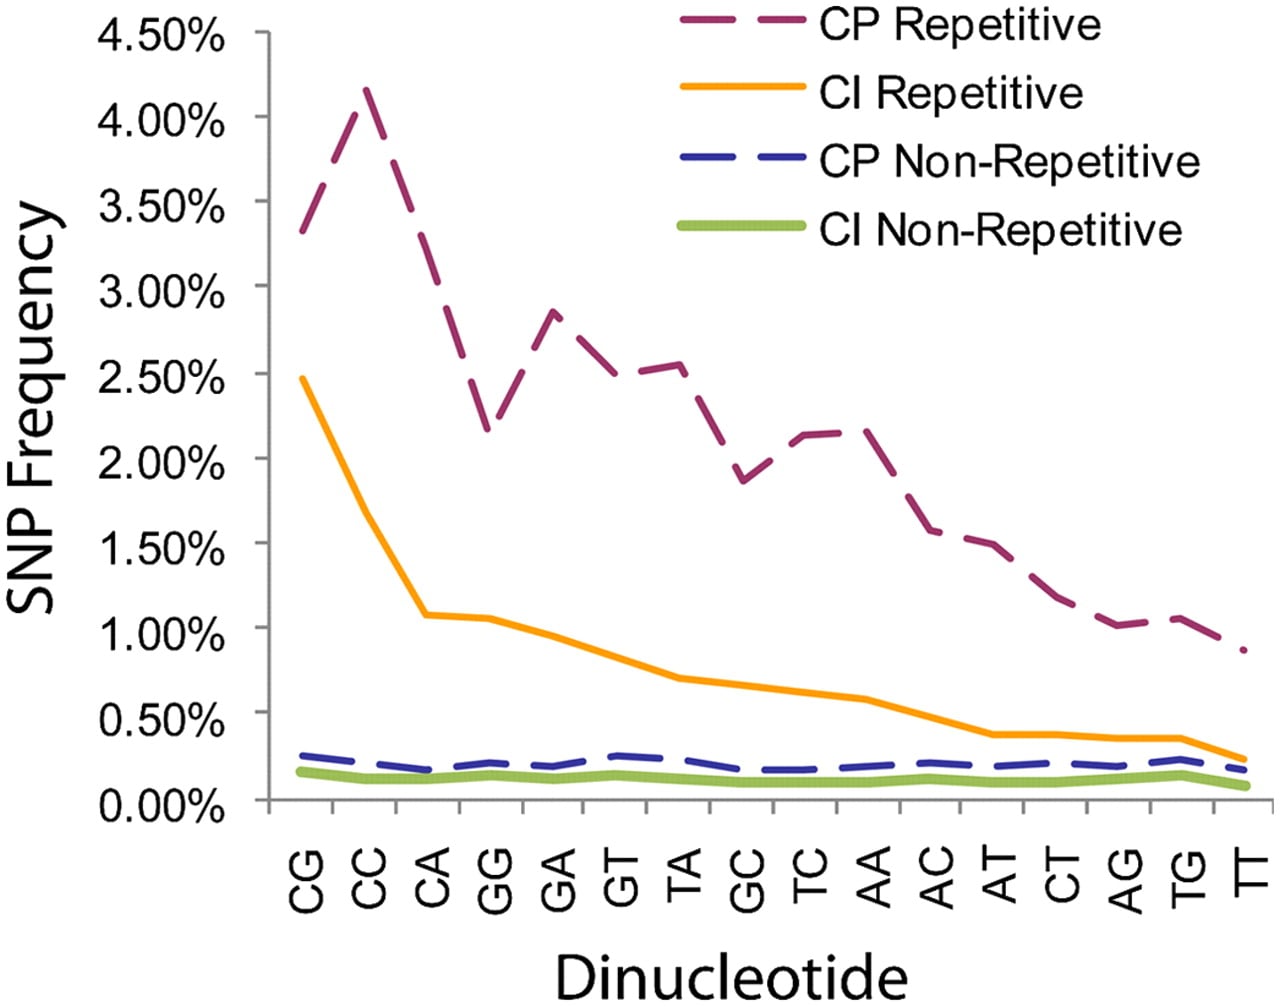
Figure 3.
Dinucleotide mutational profile of repetitive and nonrepetitive sequence, normalized by dinucleotide abundance. The vertical axis represents the fraction of SNP-callable locations that are polymorphic (averaged across all isolates for a species), relative to the appropriate reference genome (RS for C. immitis and RMSCC_3488 for C. posadasii). SNP rates for all dinucleotides are higher in repetitive sequence and also in C. posadasii isolates. In addition, CpG and CpC show the highest mutational rates.