AUCs of best performing models using the promoter activity data set
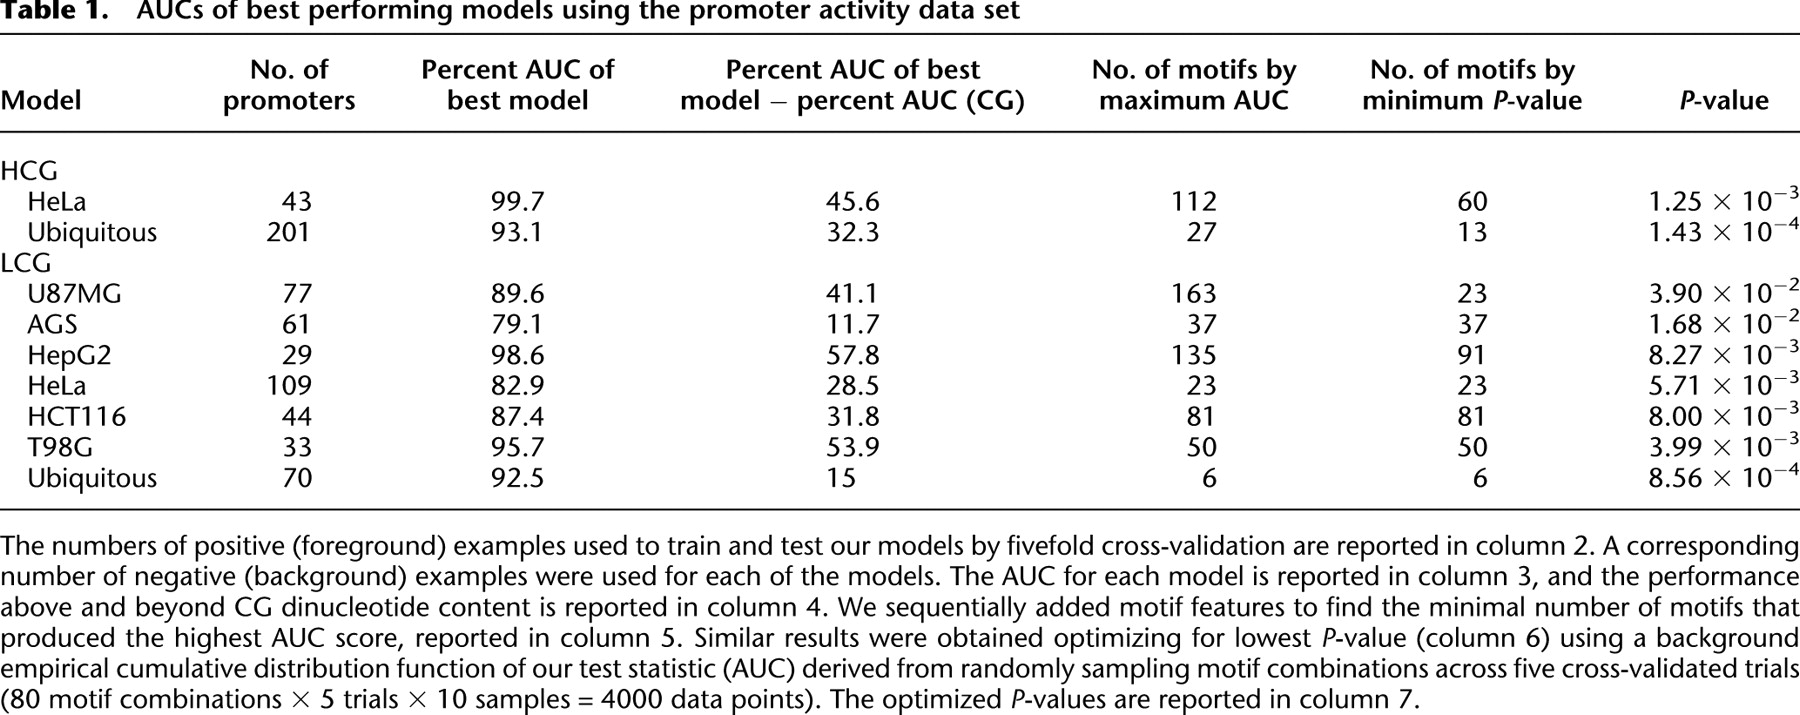
[i] The numbers of positive (foreground) examples used to train and test our models by fivefold cross-validation are reported in column 2. A corresponding number of negative (background) examples were used for each of the models. The AUC for each model is reported in column 3, and the performance above and beyond CG dinucleotide content is reported in column 4. We sequentially added motif features to find the minimal number of motifs that produced the highest AUC score, reported in column 5. Similar results were obtained optimizing for lowest P-value (column 6) using a background empirical cumulative distribution function of our test statistic (AUC) derived from randomly sampling motif combinations across five cross-validated trials (80 motif combinations × 5 trials × 10 samples = 4000 data points). The optimized P-values are reported in column 7.