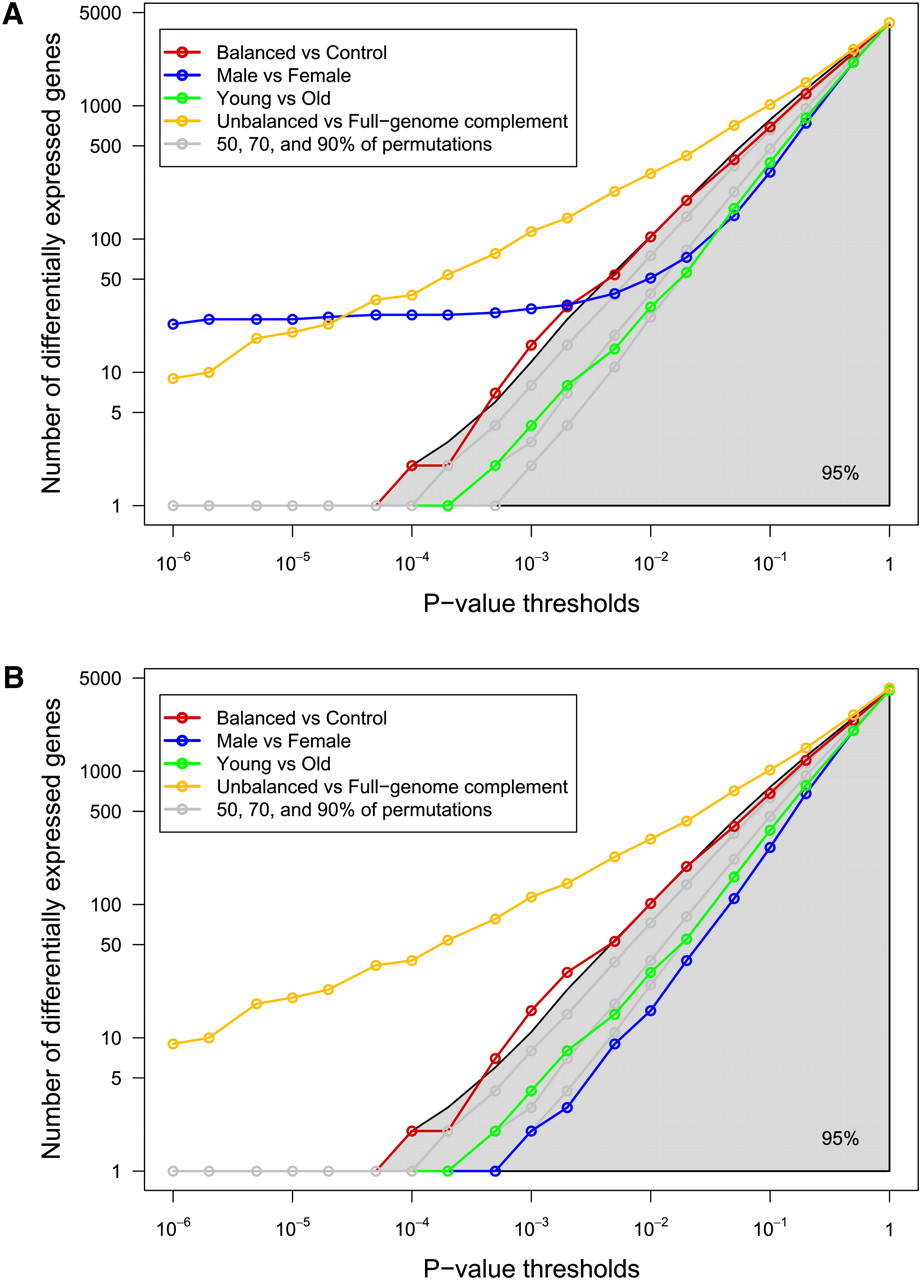
Numbers of differentially expressed transcripts between t(11;22) carriers and control individuals. Graphs showing the number of differentially expressed transcripts between the studied cohorts identified with variable P-value thresholds and mapping on all (A) or autosomal only (B) chromosomes. Axes are in log scale. The following comparisons are shown: balanced [i.e., t(11;22) carriers] versus control cohorts (red line; nine vs. 13 samples), male versus female cohorts (blue line; six vs. 16 samples), young versus old cohorts (green line; nine vs. 13), and unbalanced (Emanuel syndrome patients, with partial trisomy 11 and 22) versus full-genome complement cohorts (unbalanced [four] vs. others [22]; orange line). Note that the sex and aneuploid/euploid comparisons are provided for information only. They involve different numbers of samples and therefore cannot be directly compared with the “balanced versus control” statistics or to the permutation distribution (see below). These two comparisons and the age comparison are compared with their own permutation results in Supplemental Figures S3, S4, and S5. The gray lines and shaded area represent 50%, 70%, 90%, and 95% of the permutation distribution (nine vs. 13; see main text for details). We observe that the number of transcripts differentially expressed between the control and the balanced cohorts follows the line demarcating 95% of the permutations, suggesting that t(11;22) carriers are at one tail of the distribution of transcriptome profiles.