Skip to main content
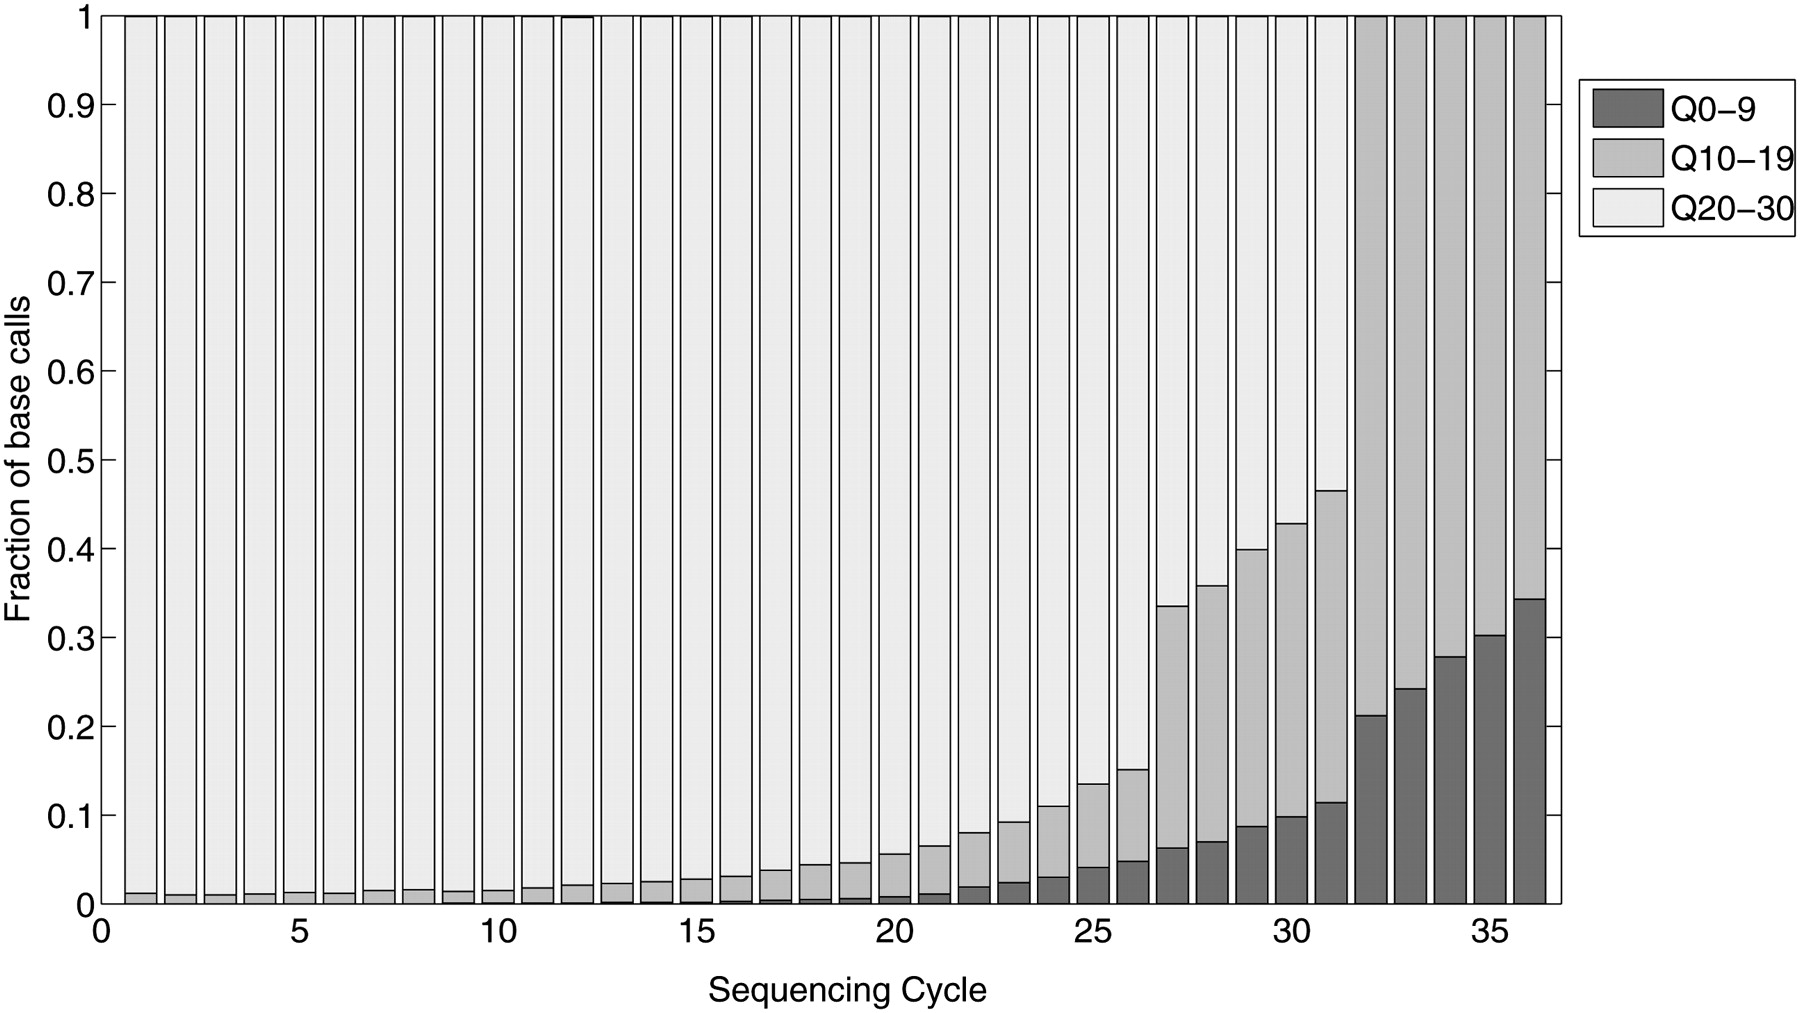
Figure 4.
Distribution of base quality values for each sequencing cycle for one of the 53 sequenced samples.