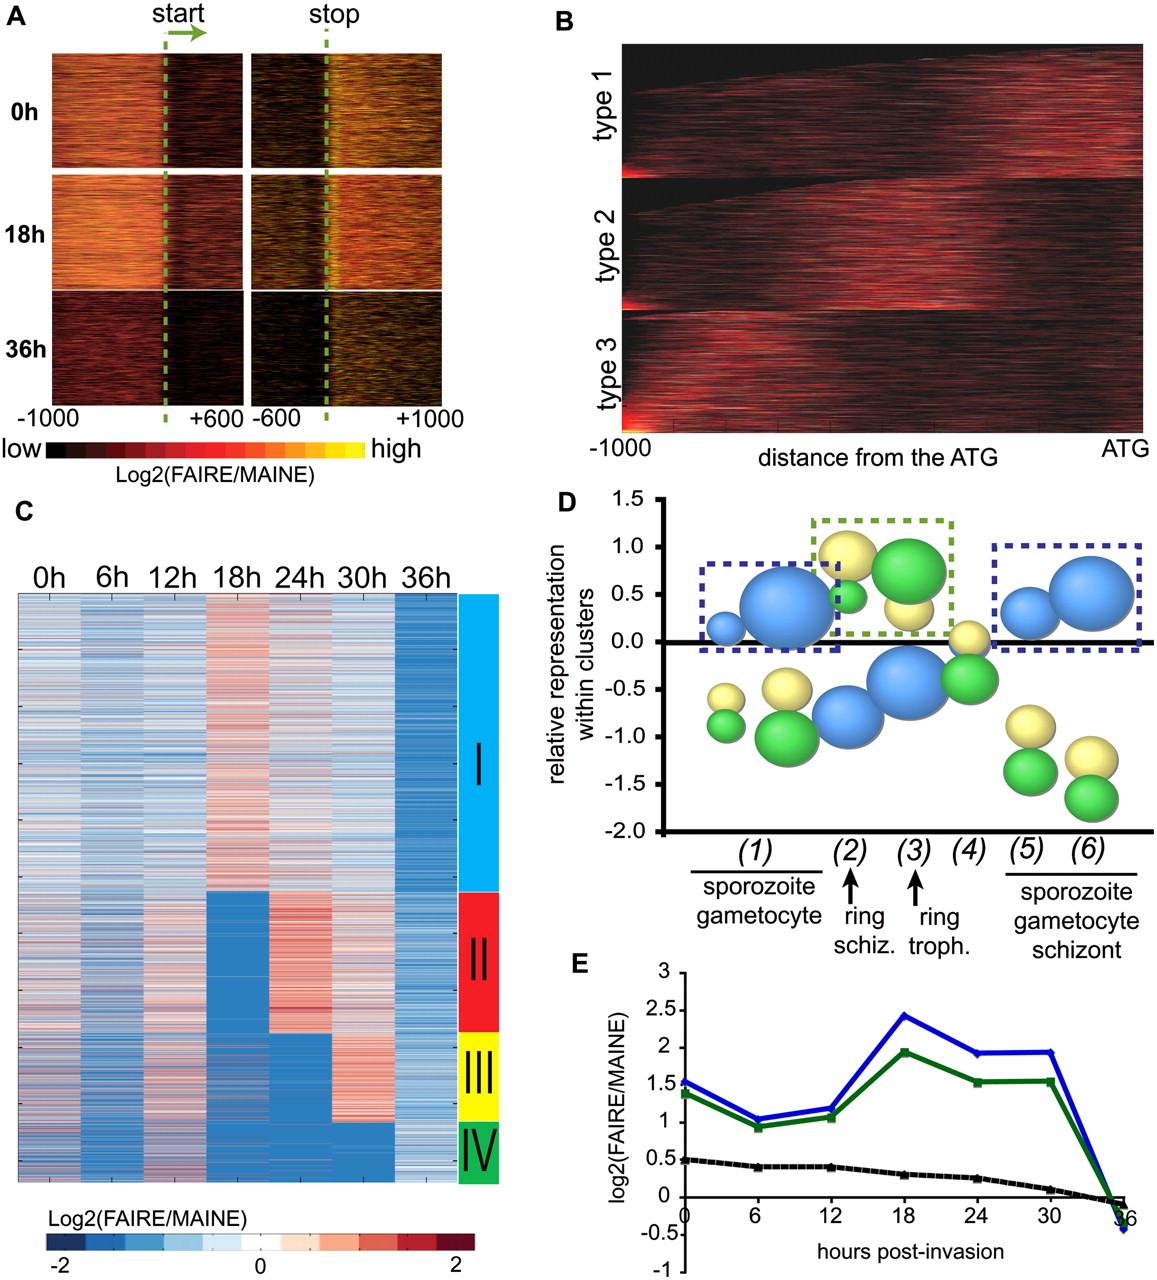
Chromatin loosens in promoter regions at the trophozoite stage and massive transcription occurs. (A) Degree of chromatin opening for regions [−1000; +600] around the start codon and [−600; +1000] the stop codon [measured by log2(FAIRE/MAINE) and color coded from low (black) to high (yellow) opening]. Each line on the y-axis represents one gene. (B) K-means clustering of 1-kb-long regions upstream of the ATGs according to the localization of highly FAIRE-enriched regions. Three groups of genes are defined according to the distance of the putative promoter from the ATG. (C) K-mean clustering of chromatin status profiles within putative promoters. Four clusters are defined. (D) Enrichment of three of our four clusters with the previously published functional clusters (Le Roch et al. 2003). The size of the bubbles reflects the significance of the overrepresentation or underrepresentation (hypergeometric test). Biggest values reflect highest significance (inverse of the P-value). Our cluster I (blue bubbles) contains a high proportion of genes expressed at sporozoite and gametocyte stages and at the schizont stage. In clusters III and IV (yellow and green bubbles, respectively), genes from ring stage are overrepresented. (E) Chromatin opening profiles [log2(FAIRE/MAINE)] in the 9-bp consensus DNA motif found in the promoters of the putative targets for PFF0200c (blue) and PF14_0633 (green). The dashed black curve represents the trend obtained using random 9-bp-long stretches of nucleotides found in 200 random promoter regions genes.