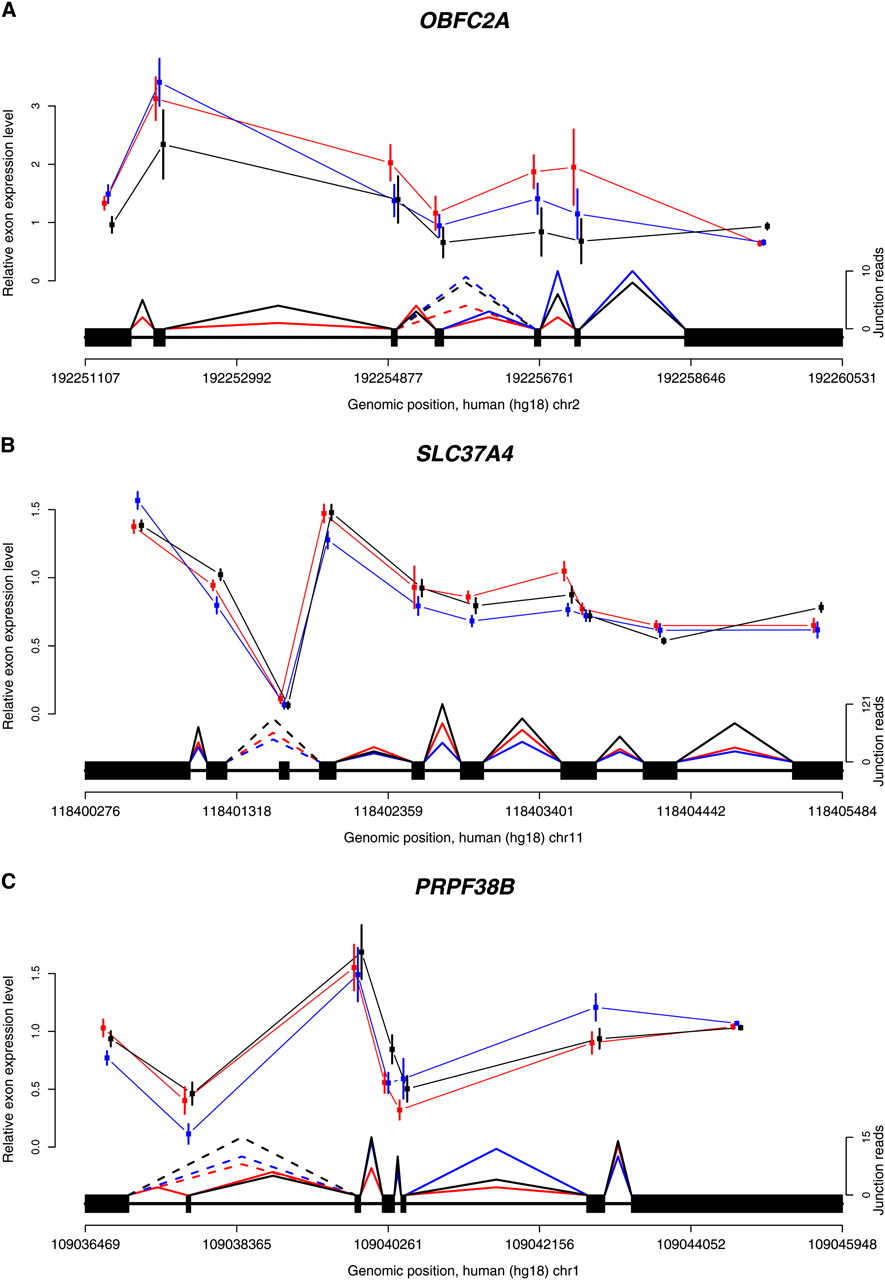
Figure 4.
Examples of conserved exon usage and alternative splicing across the three species. Mean (±SEM) relative exon expression levels (y-axis) are plotted separately for each species; (red) human; (blue) chimpanzee; (black) rhesus macaque. The gene structure appears above the x-axis, which denotes the genomic coordinates. Splice junctions identified for each species are shown as triangles connecting pairs of exons, solid lines between consecutive exons, and dotted lines between alternatively spliced exons.