Figure 2.
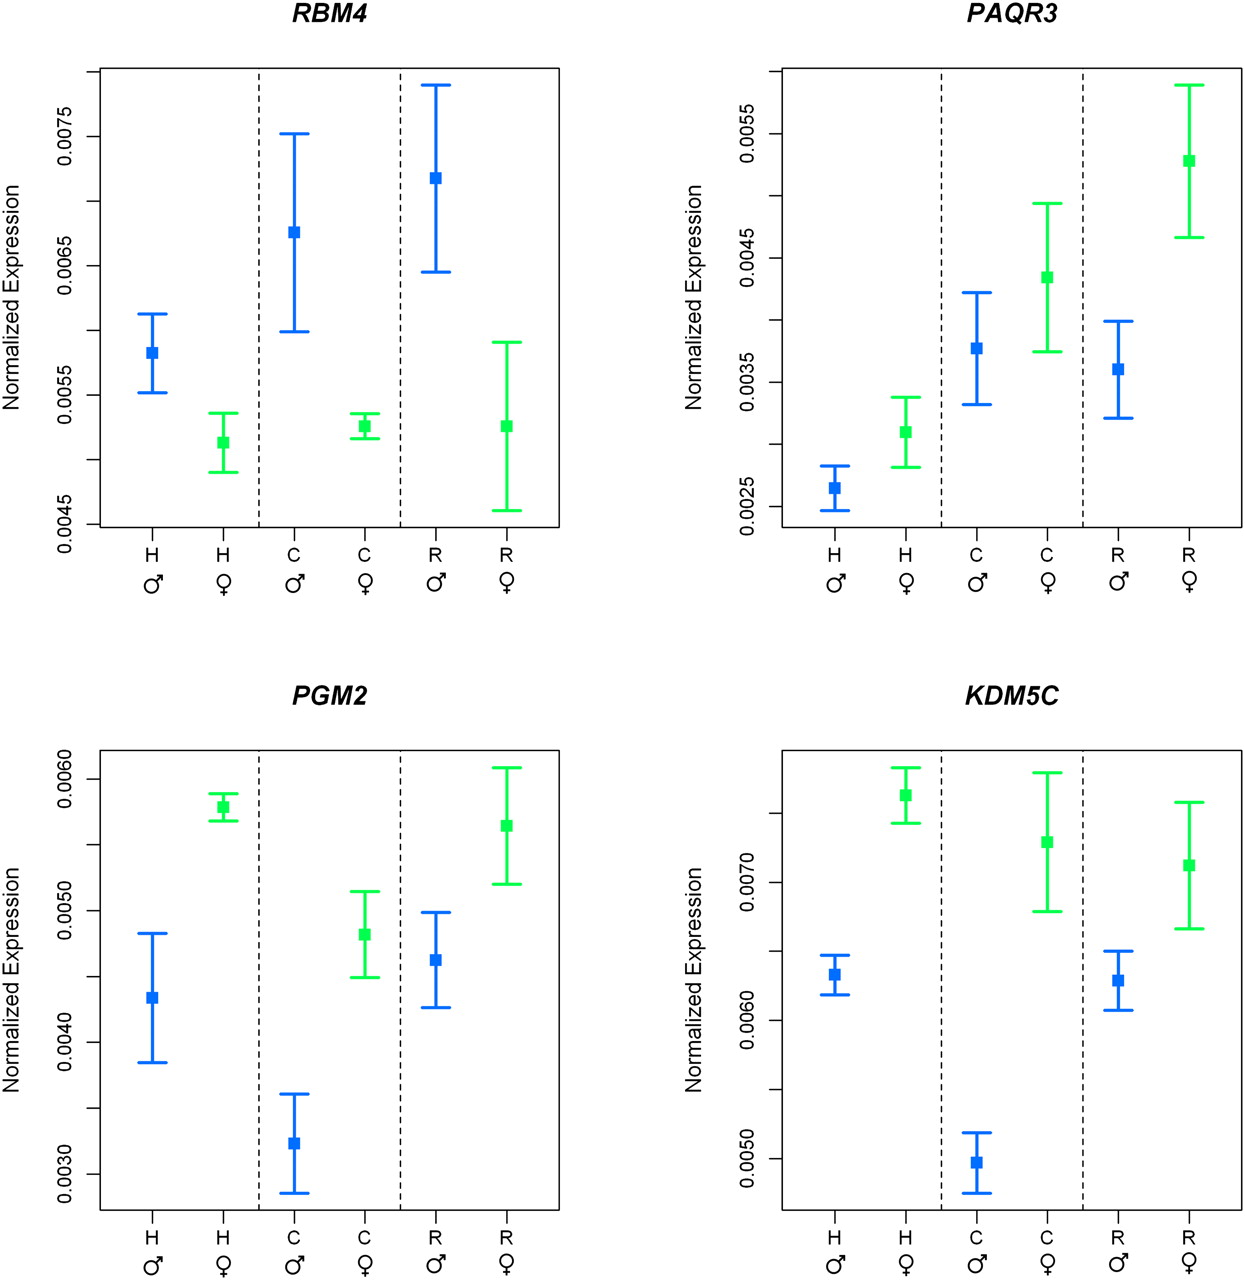
Examples of conserved sexually dimorphic gene expression patterns. In all panels, mean (±SEM) normalized expression levels (y-axis) of each species (x-axis) are plotted separately for males (blue) and females (green).
Examples of conserved sexually dimorphic gene expression patterns. In all panels, mean (±SEM) normalized expression levels (y-axis) of each species (x-axis) are plotted separately for males (blue) and females (green).