Summary of multiple linear regression models for several response variables
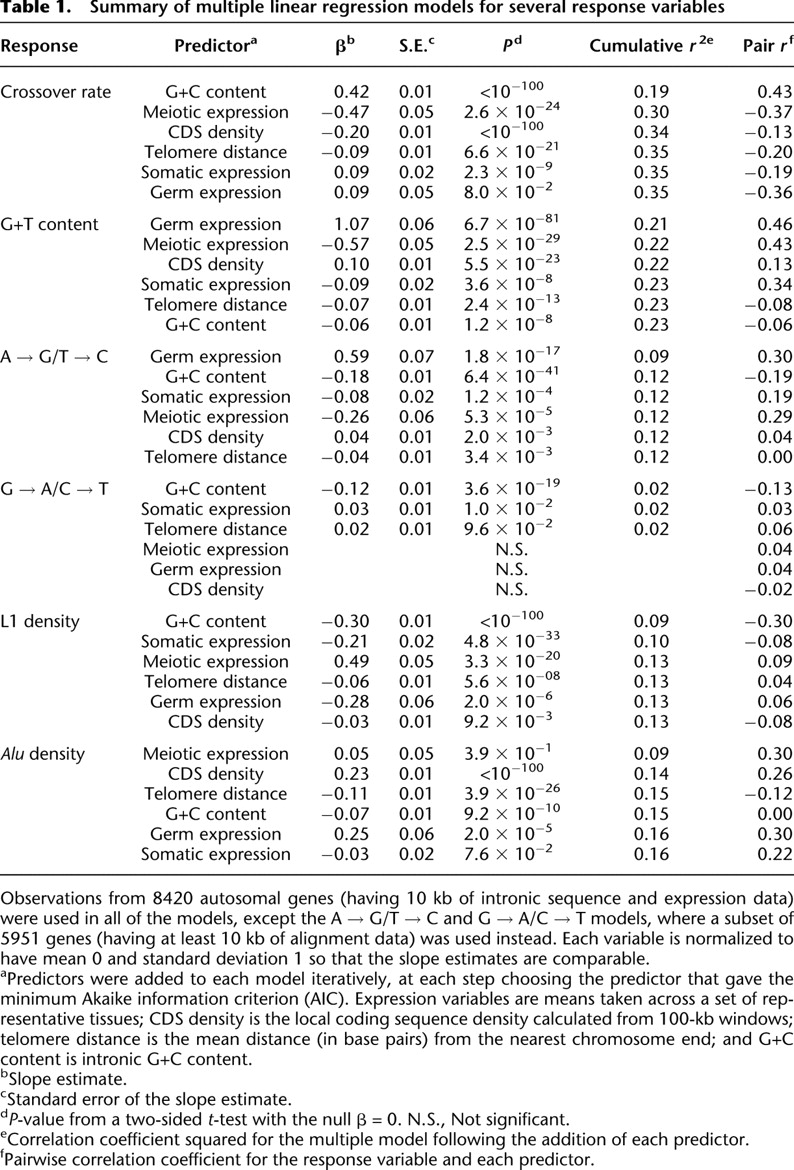
[i] Observations from 8420 autosomal genes (having 10 kb of intronic sequence and expression data) were used in all of the models, except the A → G/T → C and G → A/C → T models, where a subset of 5951 genes (having at least 10 kb of alignment data) was used instead. Each variable is normalized to have mean 0 and standard deviation 1 so that the slope estimates are comparable.
[ii] aPredictors were added to each model iteratively, at each step choosing the predictor that gave the minimum Akaike information criterion (AIC). Expression variables are means taken across a set of representative tissues; CDS density is the local coding sequence density calculated from 100-kb windows; telomere distance is the mean distance (in base pairs) from the nearest chromosome end; and G+C content is intronic G+C content.
[iii] bSlope estimate.
[iv] cStandard error of the slope estimate.
[v] dP-value from a two-sided t-test with the null β = 0. N.S., Not significant.
[vi] eCorrelation coefficient squared for the multiple model following the addition of each predictor.
[vii] fPairwise correlation coefficient for the response variable and each predictor.