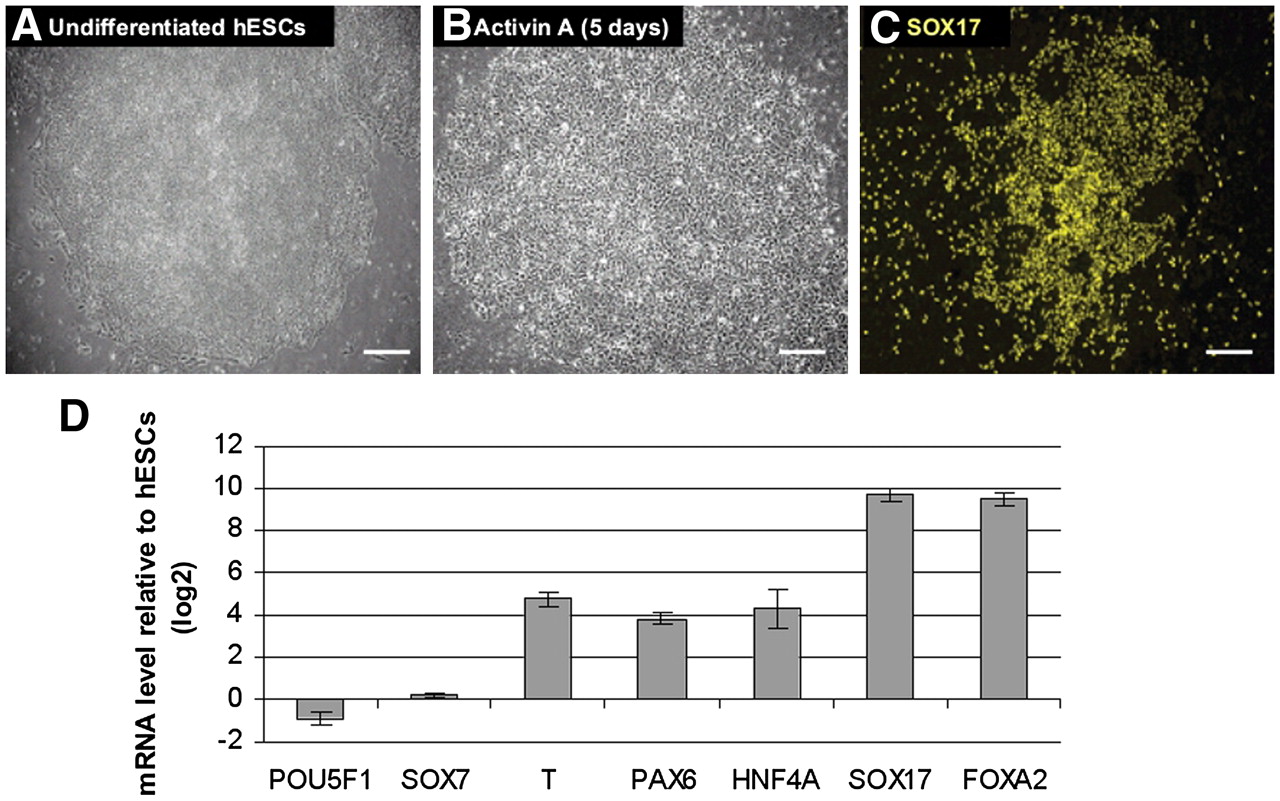
Figure 2.
Derivation of definitive endoderm from human ES cells. Phase contrast image of undifferentiated human ES cells (hESCs; A) and cells after 5 d of Activin A treatment (B). (C) Immunofluorescence labeling of differentiated cells showing SOX17 expression. Scale bars, 100 μm. (D) Effect of Activin A treatment on the gene expression of selected genes during differentiation of human ES cells. The ratios represent the mean of two independent biological replicates. Bars, SE between the biological replicates.