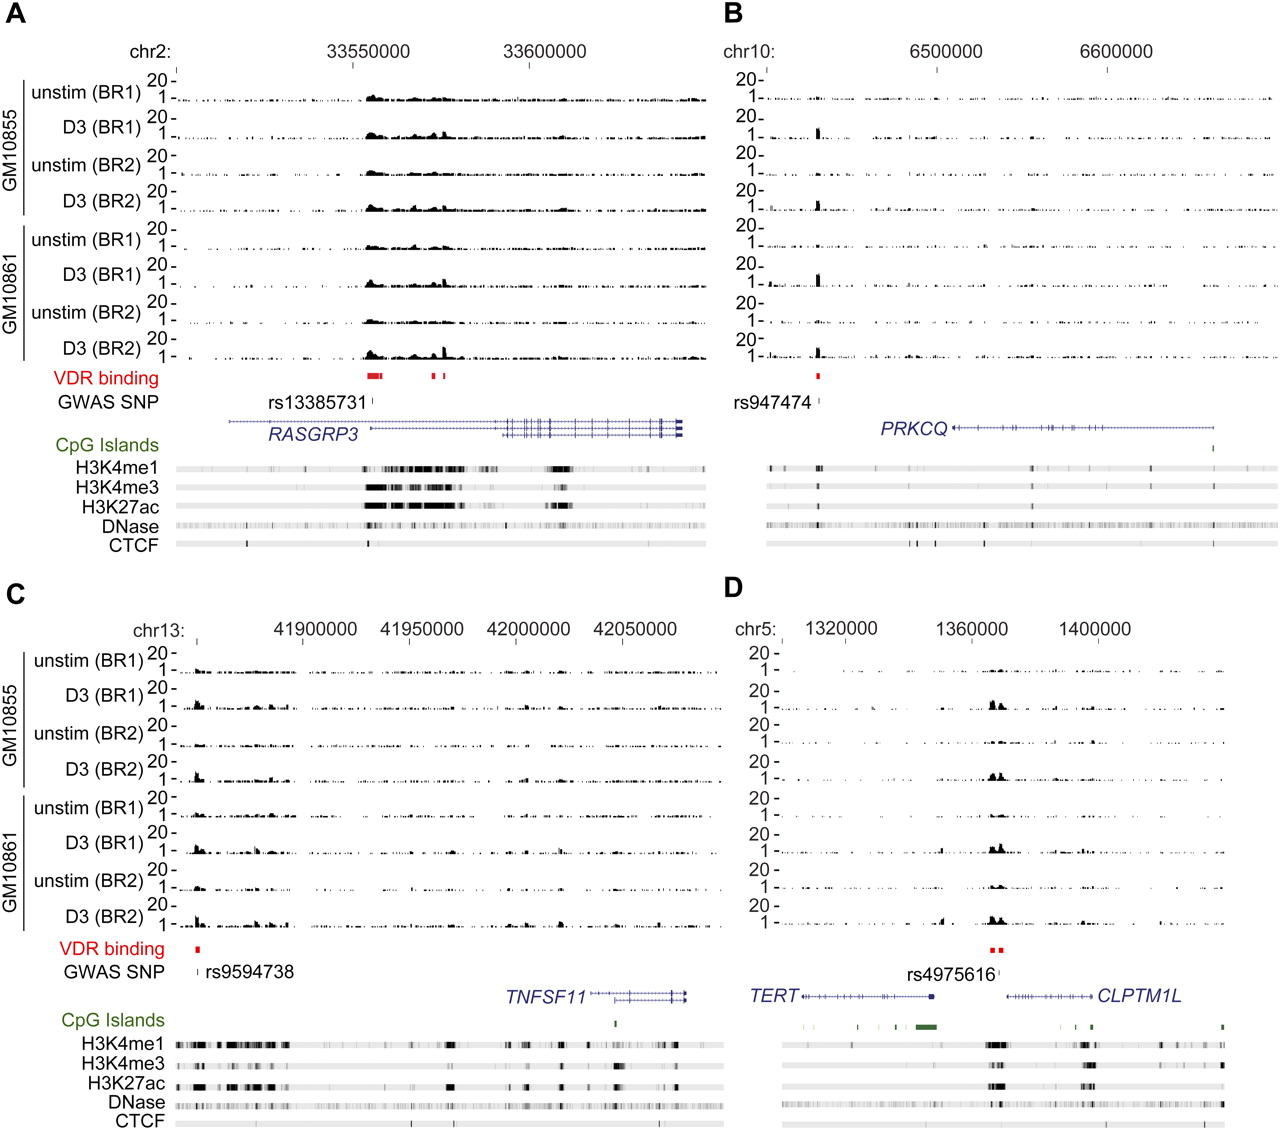
VDR ChIP-seq analysis for RASGRP3, PRKCQ, TNFSF11, and CLPTM1L. VDR ChIP-seq data shown for two biological replicates of two LCLs, GM10855 and GM10861, either resting or after induction with calcitriol for 36 h. (A) RASGRP3 and flanking sequences (chr2: 33,500,000–33,650,000) with rs13385731 (GWAS SNP marker for SLE) located in an intronic VDR binding site; (B) PRKCQ and flanking sequences (chr10: 6,400,000–6,700,000) with rs947474 (GWAS SNP marker for T1D) located in the VDR binding site 78 kb downstream from PRKCQ; (C) TNFSF11 and flanking sequences (chr13: 41,830,000–42,100,000) with rs9594738 (GWAS SNP marker for bone mineral density) 185 kb upstream of TNFSF11; (D) CLPTM1L and flanking sequences (chr5: 1,300,000–1,440,000) with rs4975616 (GWAS SNP marker for lung cancer). Also shown are ChIP-seq and DNase-seq data for GM12878 generated by the ENCODE Project (The ENCODE Project Consortium 2007).