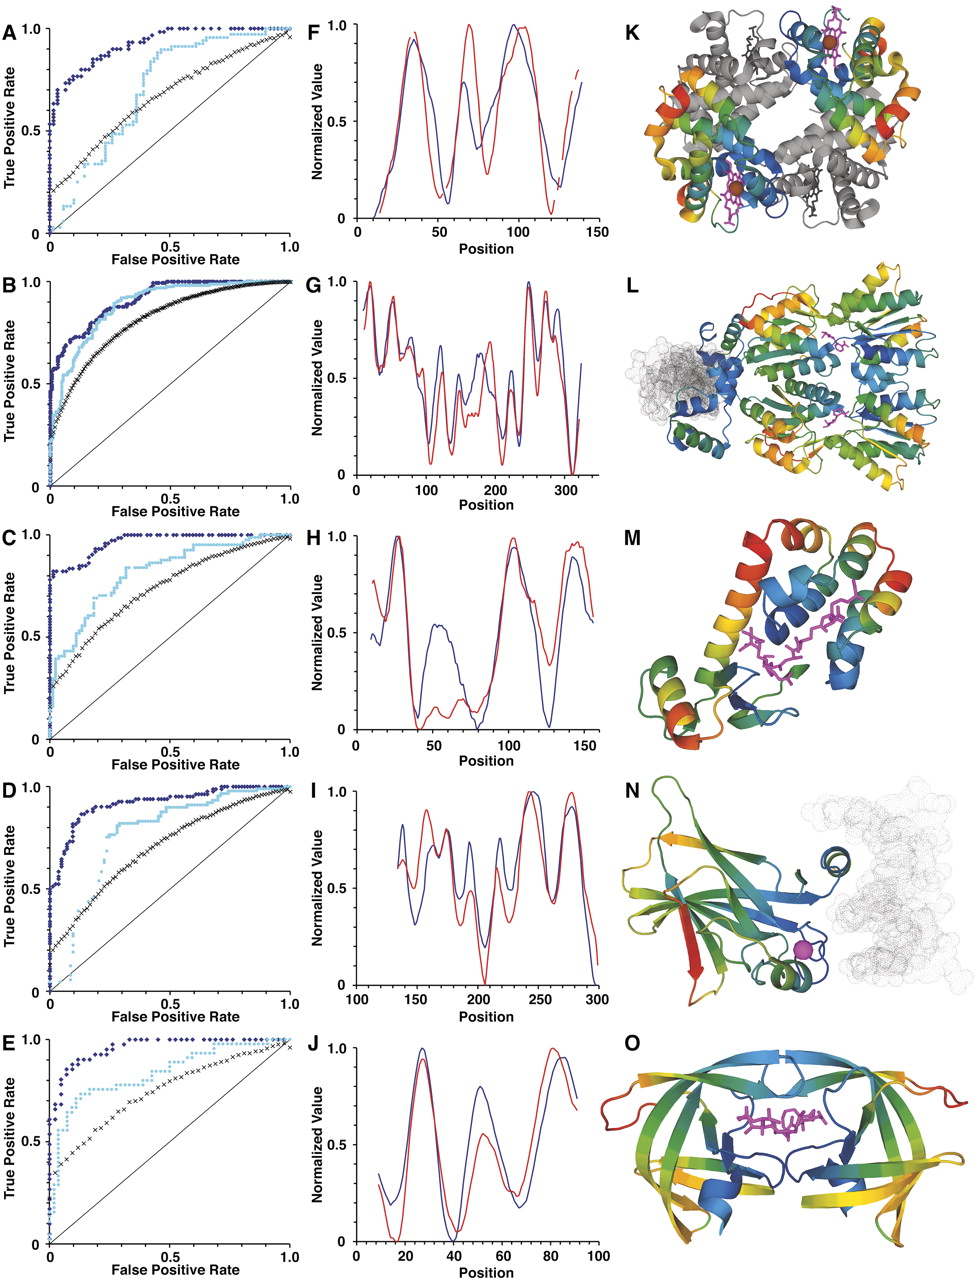
Regional evolutionary constraints accurately reflect biological importance. (A–E) Receiver operating characteristics (ROC) plots for the prediction of mutation impact by single-site evolutionary rates (light blue dots), regional evolutionary rates (dark blue diamonds), and “regional” rates from randomly permuted alignments (black Xs), for beta-globin (A), lactose repressor (B), lysozyme (C), p53 (D), and protease (E). For the full range of rate value thresholds of constraint prediction, the true-positive rate (TP/[TP + FN]) is plotted along the vertical axis against the false-positive rate (FP/[FP + TN]) on the horizontal axis. Random predictions would fall along the light-black diagonal lines. (F–J, blue) Evolutionary constraint profiles and (red) mutation impact profiles for beta-globin (F), lactose repressor (G), lysozyme (H), p53 (I), and protease (J). The normalized constraint and mutation impact values are plotted on the vertical axes, versus protein position on the horizontal axes. (K–O) Molecular structures of the five proteins color-coded with regional evolutionary rates: (blues) low rates (constrained regions); (green) average rates; (orange and red) high rates (unconstrained regions). (K) Human hemoglobin tetramer (PDB ID 4HHB; Fermi et al. 1984). The two beta-globin subunits are color-coded by evolutionary rate: (magenta) the two heme groups bound by beta-globins; (brown) their coordinated iron atoms. (Gray) The two alpha-globin subunits and their associated heme groups and iron atoms. (L) E. coli lactose repressor dimer in repressing conformation (PDB ID 1EFA; Bell and Lewis 2000). The repressor dimer is shown bound to operator DNA (gray), as well as the anti-inducer orthonitrophenylfucoside (which binds in the same pocket as the inducer) (magenta). (M) Bacteriophage T4 lysozyme mutant covalently bound to substrate-product intermediate (PDB ID 148L; Kuroki et al. 1993). (Magenta) The ligand, a glycosyl intermediate of E. coli cell wall cleavage, is bound in the active site of the enzyme. (N) Human tumor suppressor p53 core domain bound to DNA (PDB ID 1TSR; Cho et al. 1994). (Gray) DNA; (magenta) the bound zinc atom. (O) HIV-1 protease dimer (PDB ID 4HVP; Miller et al. 1989). (Magenta) A peptide inhibitor is shown bound in the substrate-binding pocket.