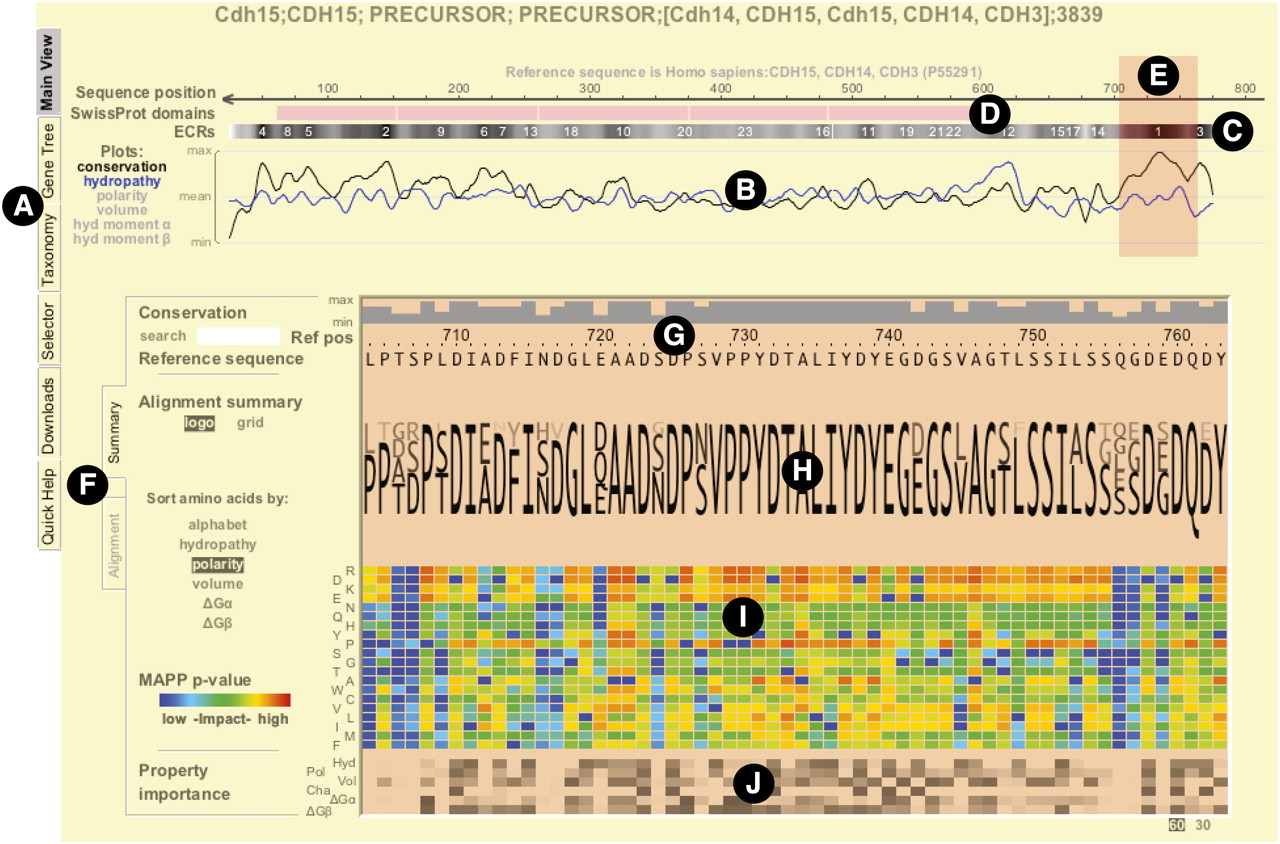
The ProPhylER Interface. (A) Tabs to the left of the window control the Interface view. The Main view opens by default and is portrayed here. (B) Profiles of regional evolutionary constraint (black line) and physicochemical properties (hydropathy shown, blue line). Features to plot are selected from the list on the left. The vertical axis of the plot shows the level of constraint or property relative to the protein average. The horizontal axis is position in the protein in the coordinates of the reference sequence. (C) A track showing the evolutionarily constrained regions (ECRs) of the protein. The numbers in the track rank ECRs by level of constraint, and the intensity of the dark shading is proportional to the magnitude of constraint. (D) A track showing domains in the reference sequence (pink bars) annotated by SWISS-PROT, if any. (E) A shaded window over the profile in the upper panel controls the view in the lower panel. The view is changed by clicking and holding the computer mouse over the shaded window and dragging it left or right. (F) Tabs switch the view in the lower panel between the default Summary view and the Alignment view. (G) The top of the lower panel displays the reference sequence. The single-position constraint values are plotted as gray bars above the sequence. The relative constraint value is indicated on the vertical axis. (H) A summary of the alignment in logos format. Selecting the “grid” option to the left of the summary displays a grid on which each amino acid is shaded according to its prevalence at each position. (I) Grid displaying color-coded values at every protein position indicating the impact of each possible mutation predicted by the MAPP procedure. (Shades of blue) Low-impact mutations; (yellow, orange, or red) increasingly high-impact mutations. (J) Grid displaying the relative importance of six physicochemical properties at each position in the protein. The intensity of the dark shading is proportional to the importance of the property, as estimated by the MAPP procedure.