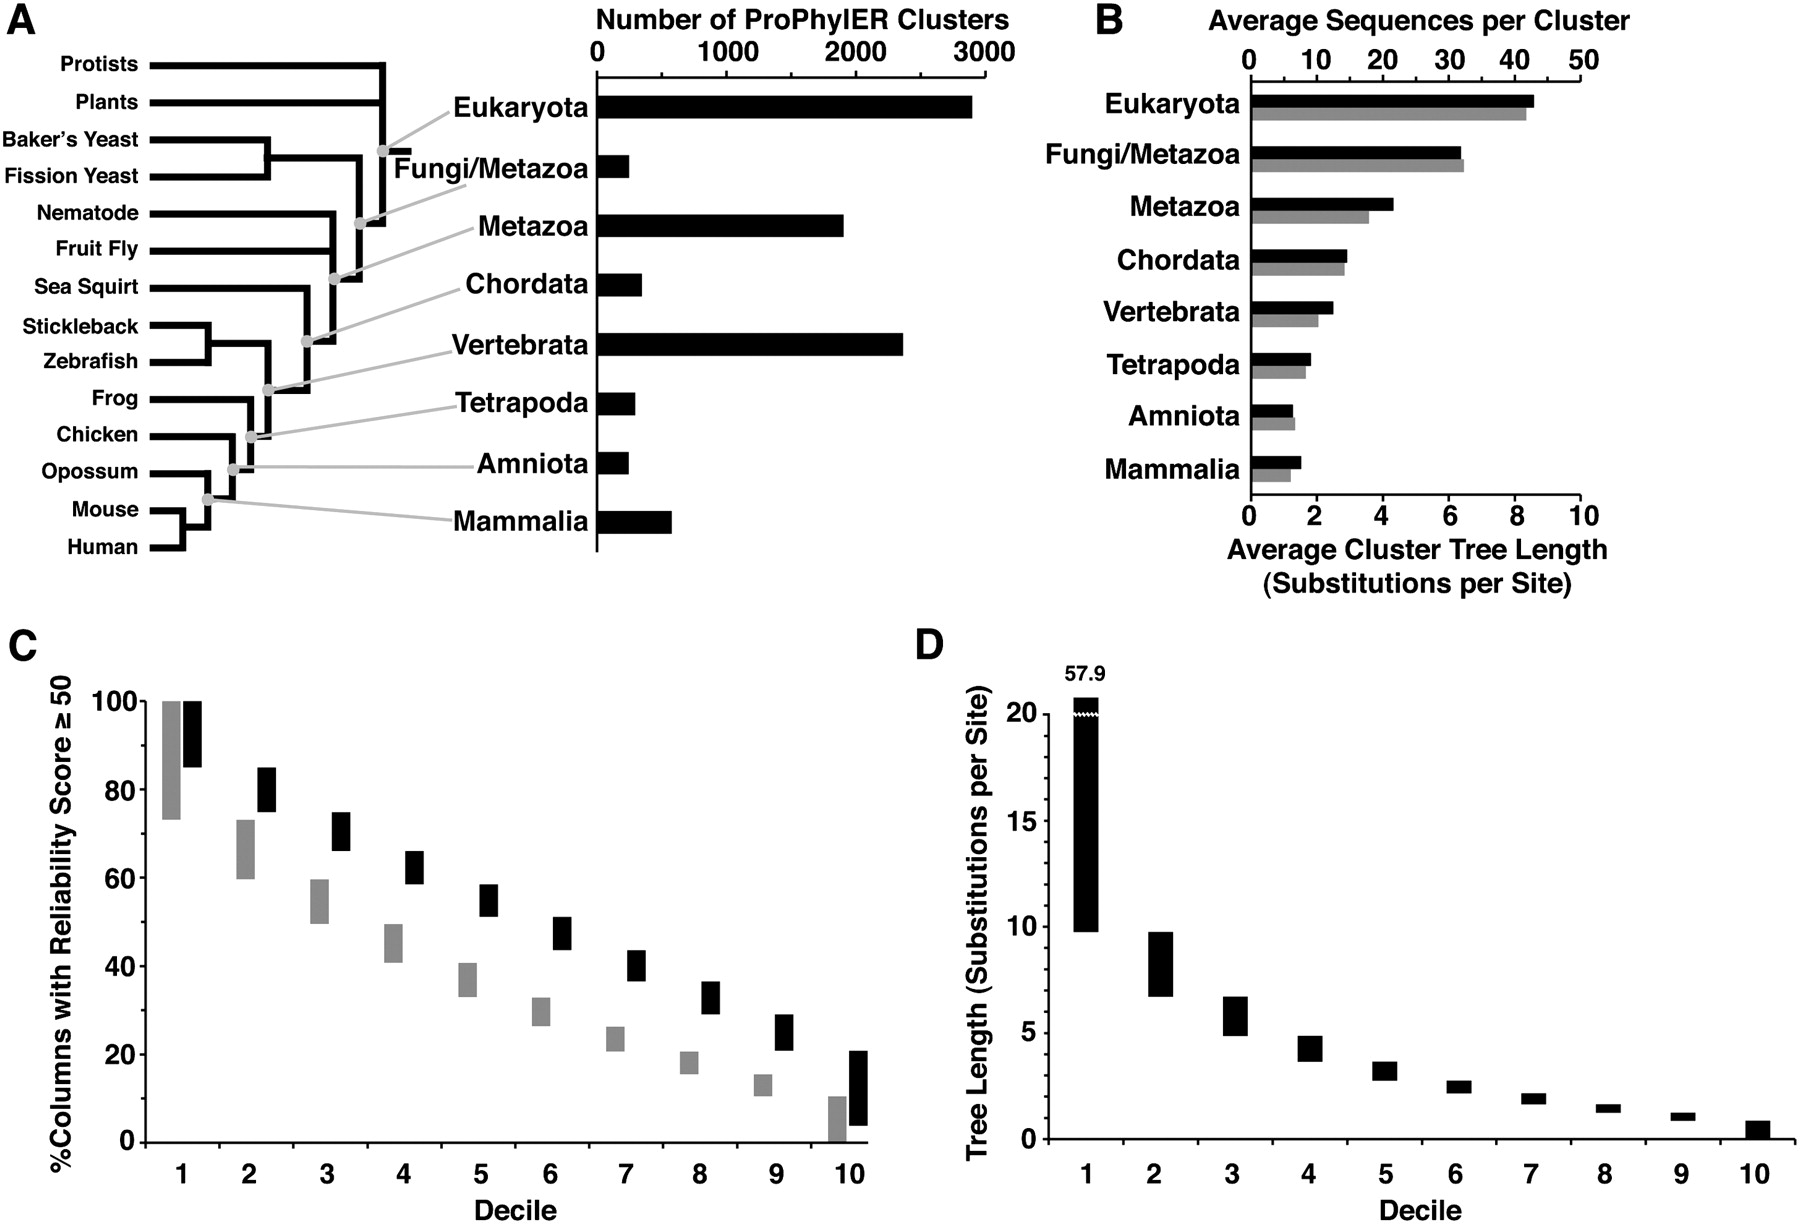
ProPhylER cluster statistics. (A) ProPhylER clusters by phylogenetic scope. (Right) A bar chart showing the number of ProPhylER clusters (horizontal axis) by major taxonomic groups (vertical axis; the groups chosen are mammal-centric, but the clusters do not necessarily include mammals). (Left) A tree relating example species from the taxonomic groups in the bar chart (branch lengths not to scale). (B) Diversity of ProPhylER clusters. A bar chart shows the average number of sequences per cluster (black bar, top horizontal axis) and the average cluster tree length in substitutions per site (gray bar, lower horizontal axis) grouped by phylogenetic scope (vertical axis). (C) ProPhylER alignment quality. Histogram showing the percentage of alignment columns with a ProbCons reliability score of 50 or higher per sequence for all ProPhylER alignments (vertical axis), by decile (horizontal axis), (gray bars) before curation and (black bars) after curation. (D) ProPhylER cluster diversity. Histogram showing the total tree length (in substitutions per site) of all ProPhylER clusters (vertical axis), by decile (horizontal axis).