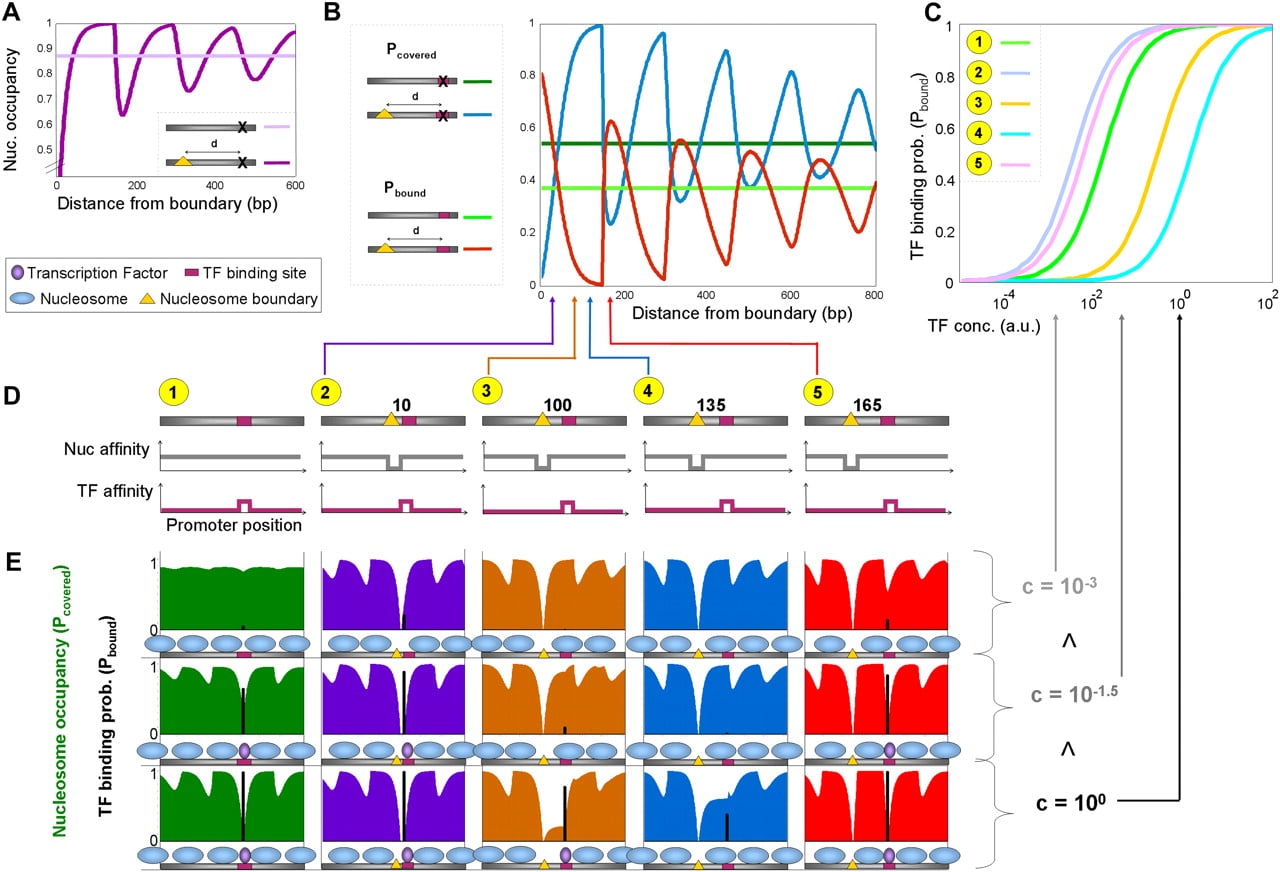
Addition of a boundary element for nucleosome formation to a simple promoter. (A) The periodic pattern of nucleosome occupancy induced by perfect boundaries for nucleosome formation (dark purple), as predicted by our thermodynamic model. Perfect boundaries are assumed to never be occluded by nucleosomes. Shown is the nucleosome formation probability at each base pair, Pcovered, as a function of the distance from the boundary. The same probability is computed for a sequence with no boundaries (pink). (B) Probabilities for transcription factor binding and nucleosome formation as a function of the distance from a boundary element. Shown is the probability of a transcription factor site to be bound, Pbound (red), and the probability of the center base pair within the binding site to be covered by a nucleosome, Pcovered (blue), as a function of the distance d of the site from the boundary, under a fixed transcription factor concentration (see Table 1). For comparison, Pbound and Pcovered values, under the same transcription factor concentration, for a corresponding binding site on a promoter with no boundaries (light green and dark green curves, respectively), are also displayed. (C) Shown are graphs of transcription factor binding probabilities, Pbound, at increasing transcription factor concentrations, for the promoters described in D, in which the transcription factor binding sites are located at different distances from a nucleosome boundary element. (D) Schematic illustrations for the promoters used in C and E and the associated binding affinities for nucleosomes and transcription factors. (E) Shown in color is the nucleosome formation probability at every base pair, Pcovered, for each of the promoters in D. Shown in black is the probability of transcription factor binding, Pbound. For each promoter, we present Pcovered and Pbound values at three concentrations of the corresponding transcription factor, (10−3, 10−1.5, and 100). We also illustrate the probable configuration of transcription factors and nucleosomes on these promoters, for each of the transcription factor concentrations, by employing a threshold (0.6) for both transcription factor binding and nucleosome formation. Note that in promoters (marked as 2 and 5) where the sites are relatively exposed at low transcription factor concentrations (owing to the effect of the boundary), the change in nucleosome occupancy in the base pairs surrounding the sites is less pronounced at higher transcription factor concentrations, compared to promoters (marked as 3 and 4) in which the sites were relatively occluded by nucleosomes at low transcription factor concentrations.