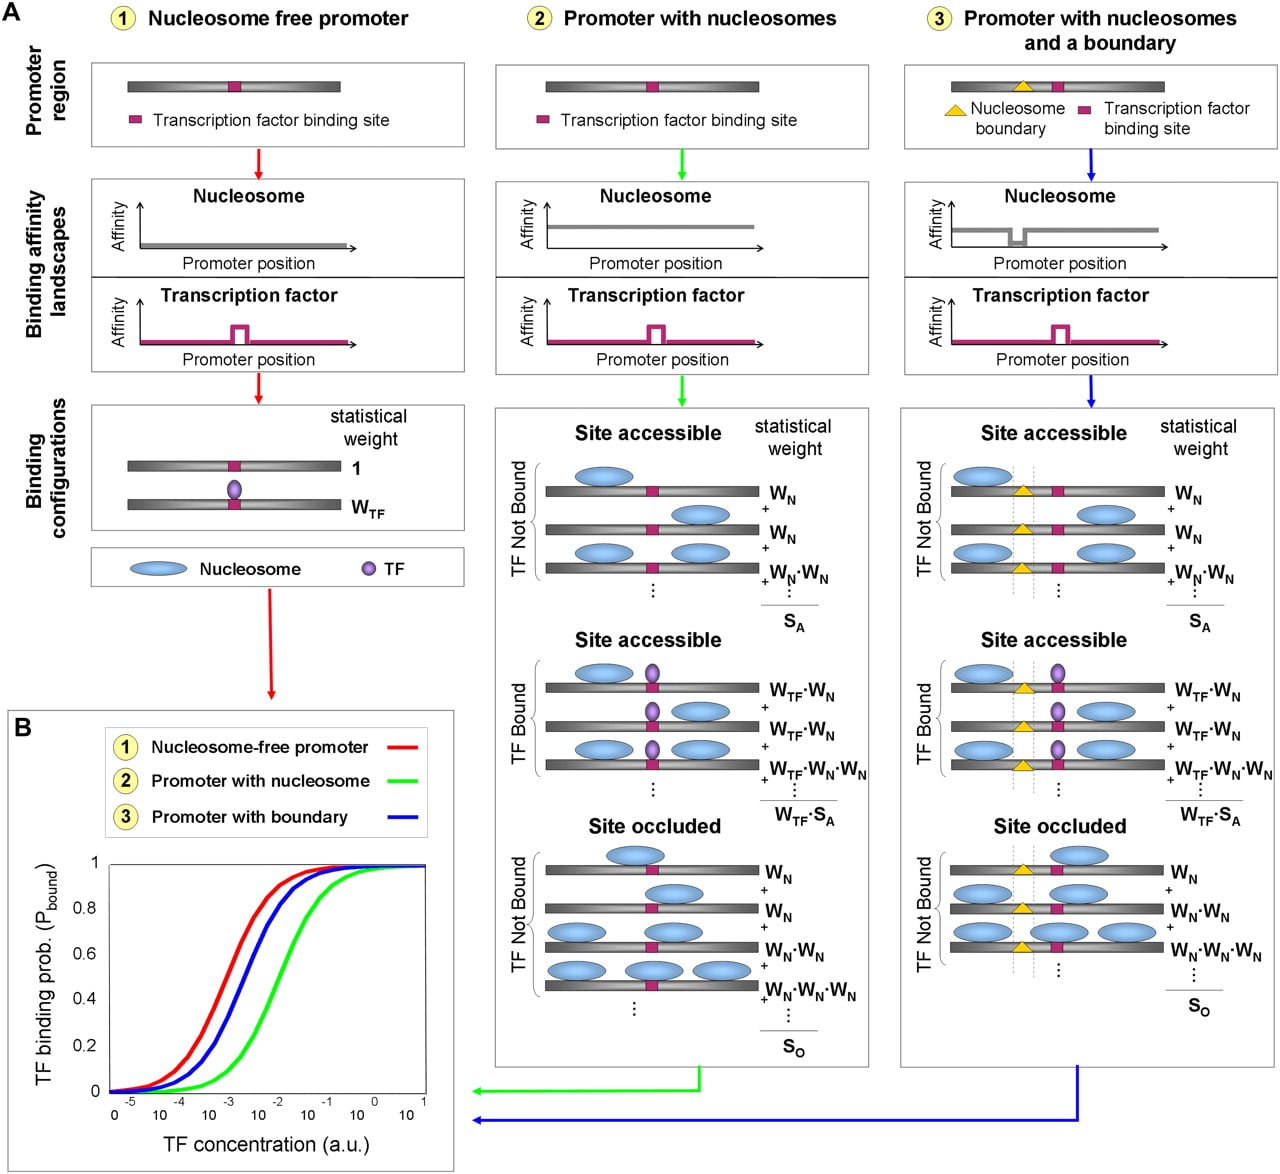
Illustration of our thermodynamic framework. Each promoter sequence encodes particular binding affinity landscapes for both transcription factors and nucleosomes. Given these landscapes as input as well as the concentrations of transcription factors and nucleosomes, our framework can then compute the distribution over all possible configurations of molecules bound to the promoter (see “Modeling Framework”). Applying these computations to different promoters (represented by different affinity landscapes) and over a range of transcription factor concentrations thus allows us to compute the activation curve of various promoters as a function of transcription factor concentrations. (A) Here we examine three promoters (discussed in detail in the Results section): (1) A nucleosome-free promoter, represented by a binding affinity landscape for nucleosomes that is zero at every promoter location. Shown are the two possible configurations (bound/unbound) with their respective statistical weights. (2) A promoter with a uniform binding affinity landscape for nucleosomes. Shown is a subset of the possible binding configurations, each with its respective statistical weight. (3) A promoter with a boundary element for nucleosome formation—resulting in a trough in the otherwise uniform landscape for nucleosomes. The transcription factor binding site is located 10 bp from the boundary element. A subset of the possible configurations is shown. Note that in all configurations the boundary element cannot be occluded by a nucleosome. (B) Promoter activation curves showing the probability of transcription factor binding at the site, Pbound, at various transcription factor concentrations (log scale, arbitrary units), for the three promoters in A. The activation curves of these promoters are identical in shape but shifted (in log scale) relative to one another.