Table 2.
Nucleotide substitution rates and their ratio of the viral sphingolipid biosynthesis genes measured by the comparisons between the group I and group II strains
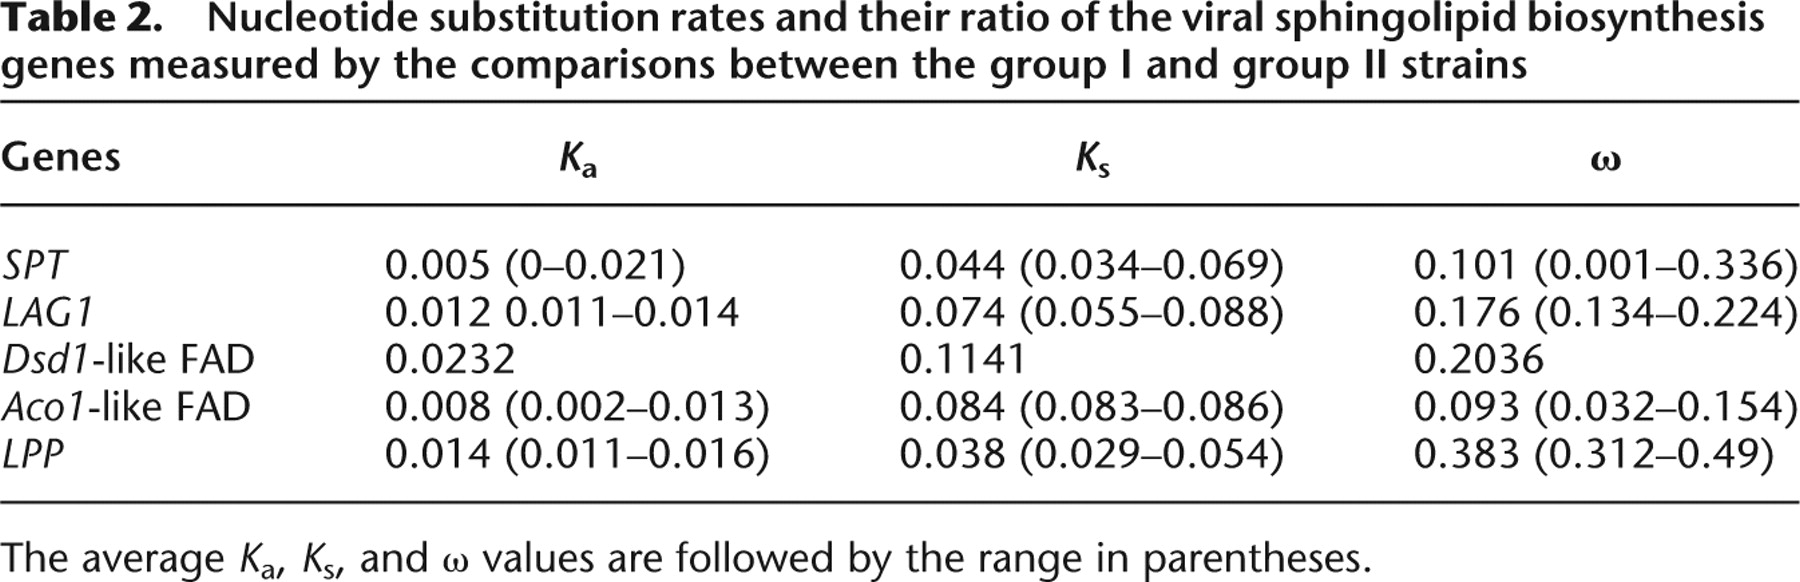
[i] The average Ka, Ks, and ω values are followed by the range in parentheses.
Nucleotide substitution rates and their ratio of the viral sphingolipid biosynthesis genes measured by the comparisons between the group I and group II strains
[i] The average Ka, Ks, and ω values are followed by the range in parentheses.