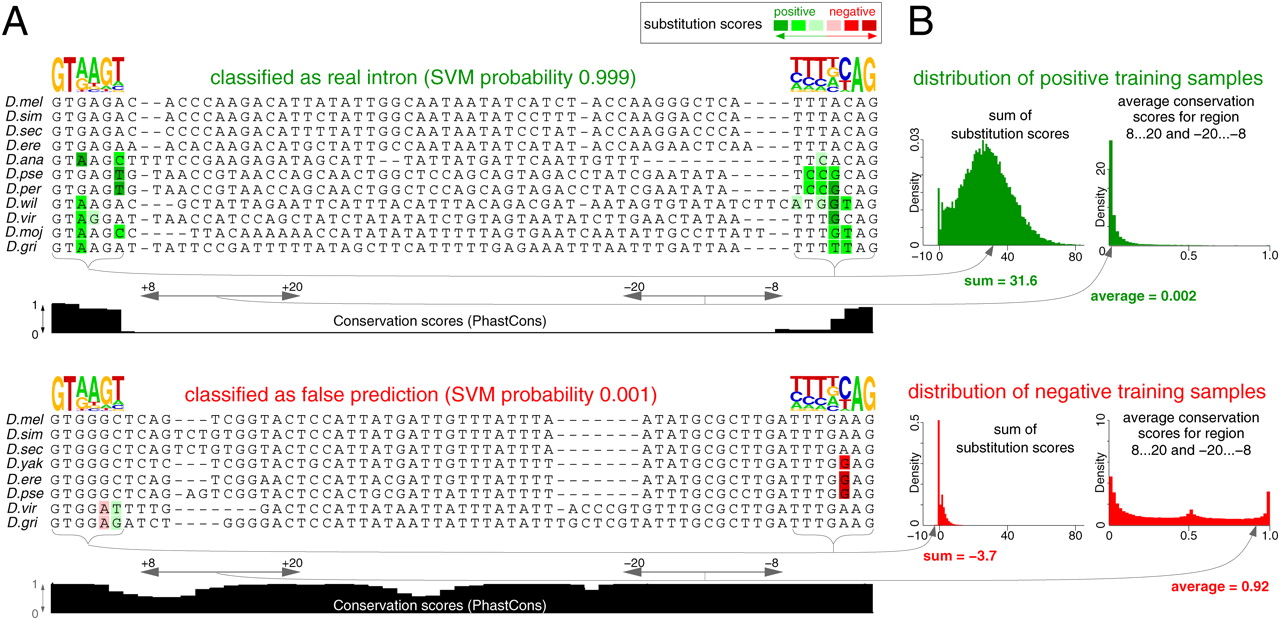
Evaluating characteristic intron evolution. (A) Two predicted introns with orthologous intronscan predictions in other species are shown. The prediction on top exhibits several substitutions in the splice site regions that are characteristic for real introns (e.g., C-to-T substitutions at acceptor position −3). Furthermore, this prediction has a low sequence conservation within the intron (average phastCons score for the region +8…+20 and −20…−8 is only 0.002). This prediction gets a high probability for being a real intron (0.999). In contrast, the prediction at the bottom has substitutions that are inconsistent with intron evolution (e.g., A-to-G substitution at acceptor position −3), and it exhibits conservation throughout the intron (average phastCons score is 0.92). The SVM probability for being a real intron is consequently low (0.001). Positive substitution scores are shown in shades of green; negatives in shades of red. Substitution scores are only considered for the donor (positions +2…+6) and acceptor splice site (positions −7…−3). Note that the substitution scores are specific for each pair D. melanogaster with another species; thus, the same substitution with respect to different species can get different scores. (B) The distribution of the summed substitution scores (left) and the average conservation scores (right) show a substantial difference between our positive and negative samples. The position of the values of the introns from panel A are indicated. For a better visualization, the y-axis for positive and negative samples has a different scale.