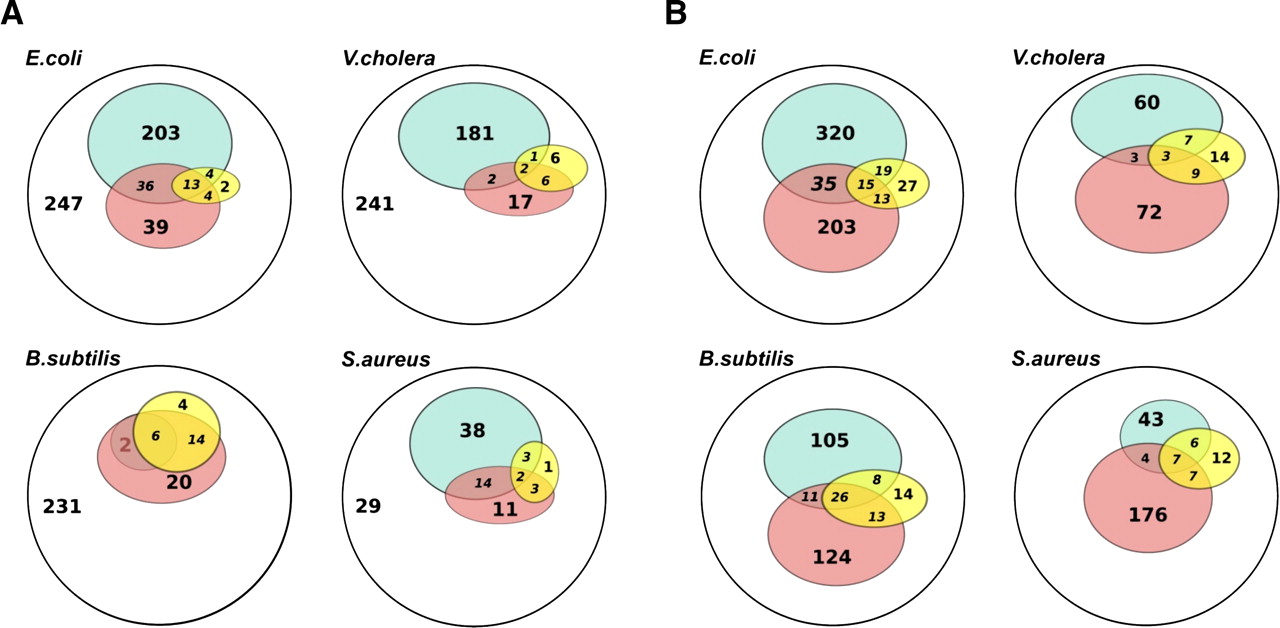
Figure 3.
Comparison of NAPP ncRNA predictions with RNAz and SIPHT predictions in four bacterial genomes. Numbers in Venn diagram areas represent the area exclusive of included subareas. Blue: ncRNA predictions from RNAz or SIPHT; pink: ncRNA predictions from the NAPP program; and yellow: known ncRNAs present in the tested set (excluding tRNA, rRNA). (A) Predictions from the RNAz program. White areas represent total numbers of candidate sequences that can be tested with RNAz. (B) Prediction from the SIPHT program. Both SIPHT and NAPP screen all conserved intergenic elements.