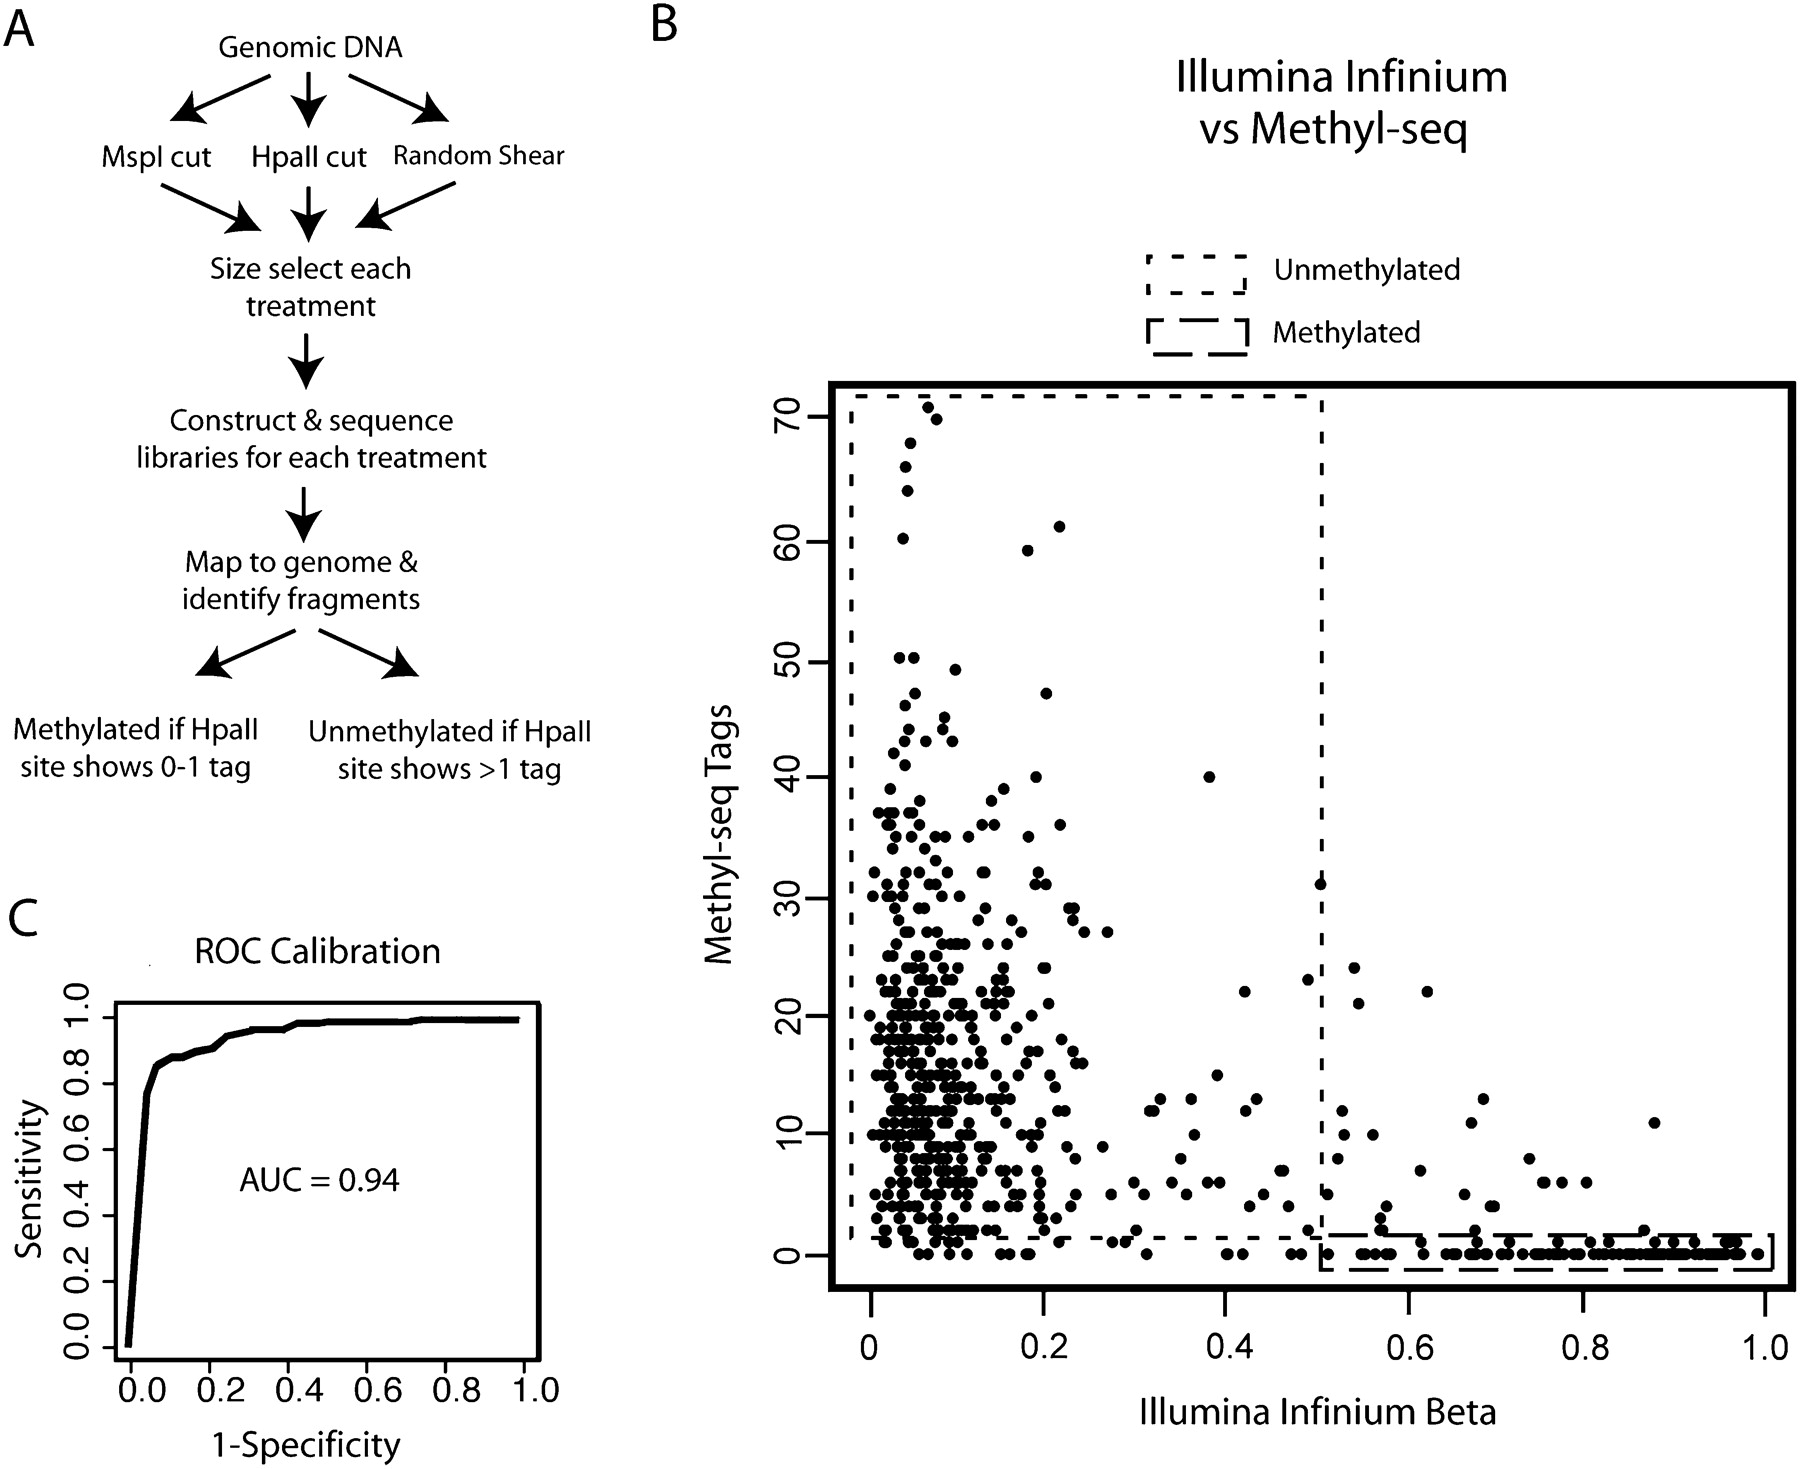
Figure 1.
The Methyl-seq method and validation. (A) Workflow for the Methyl-seq assay. (B) Comparison of the number of Methyl-seq tags and Illumina beta values at 160 CpGs for four samples: HCT116, H9 hESC, H9 endoderm, and adult liver. HCT116 was used in Methyl-seq development and validation. There is good correlation between methylated calls (zero or one Methyl-seq tags and high beta values) and, likewise, unmethylated calls (low beta values and high numbers of sequencing tags) (for binary comparison, see Supplemental Fig. 7; P-values <10−8). (C) Receiver operator characteristic (ROC) curve generated from Methyl-seq and Illumina Infinium data. The area under the curve is 0.944.