Figure 1.
A graphical illustration of the model of the demographic history of European-Americans (EAs) and African-Americans (AAs).
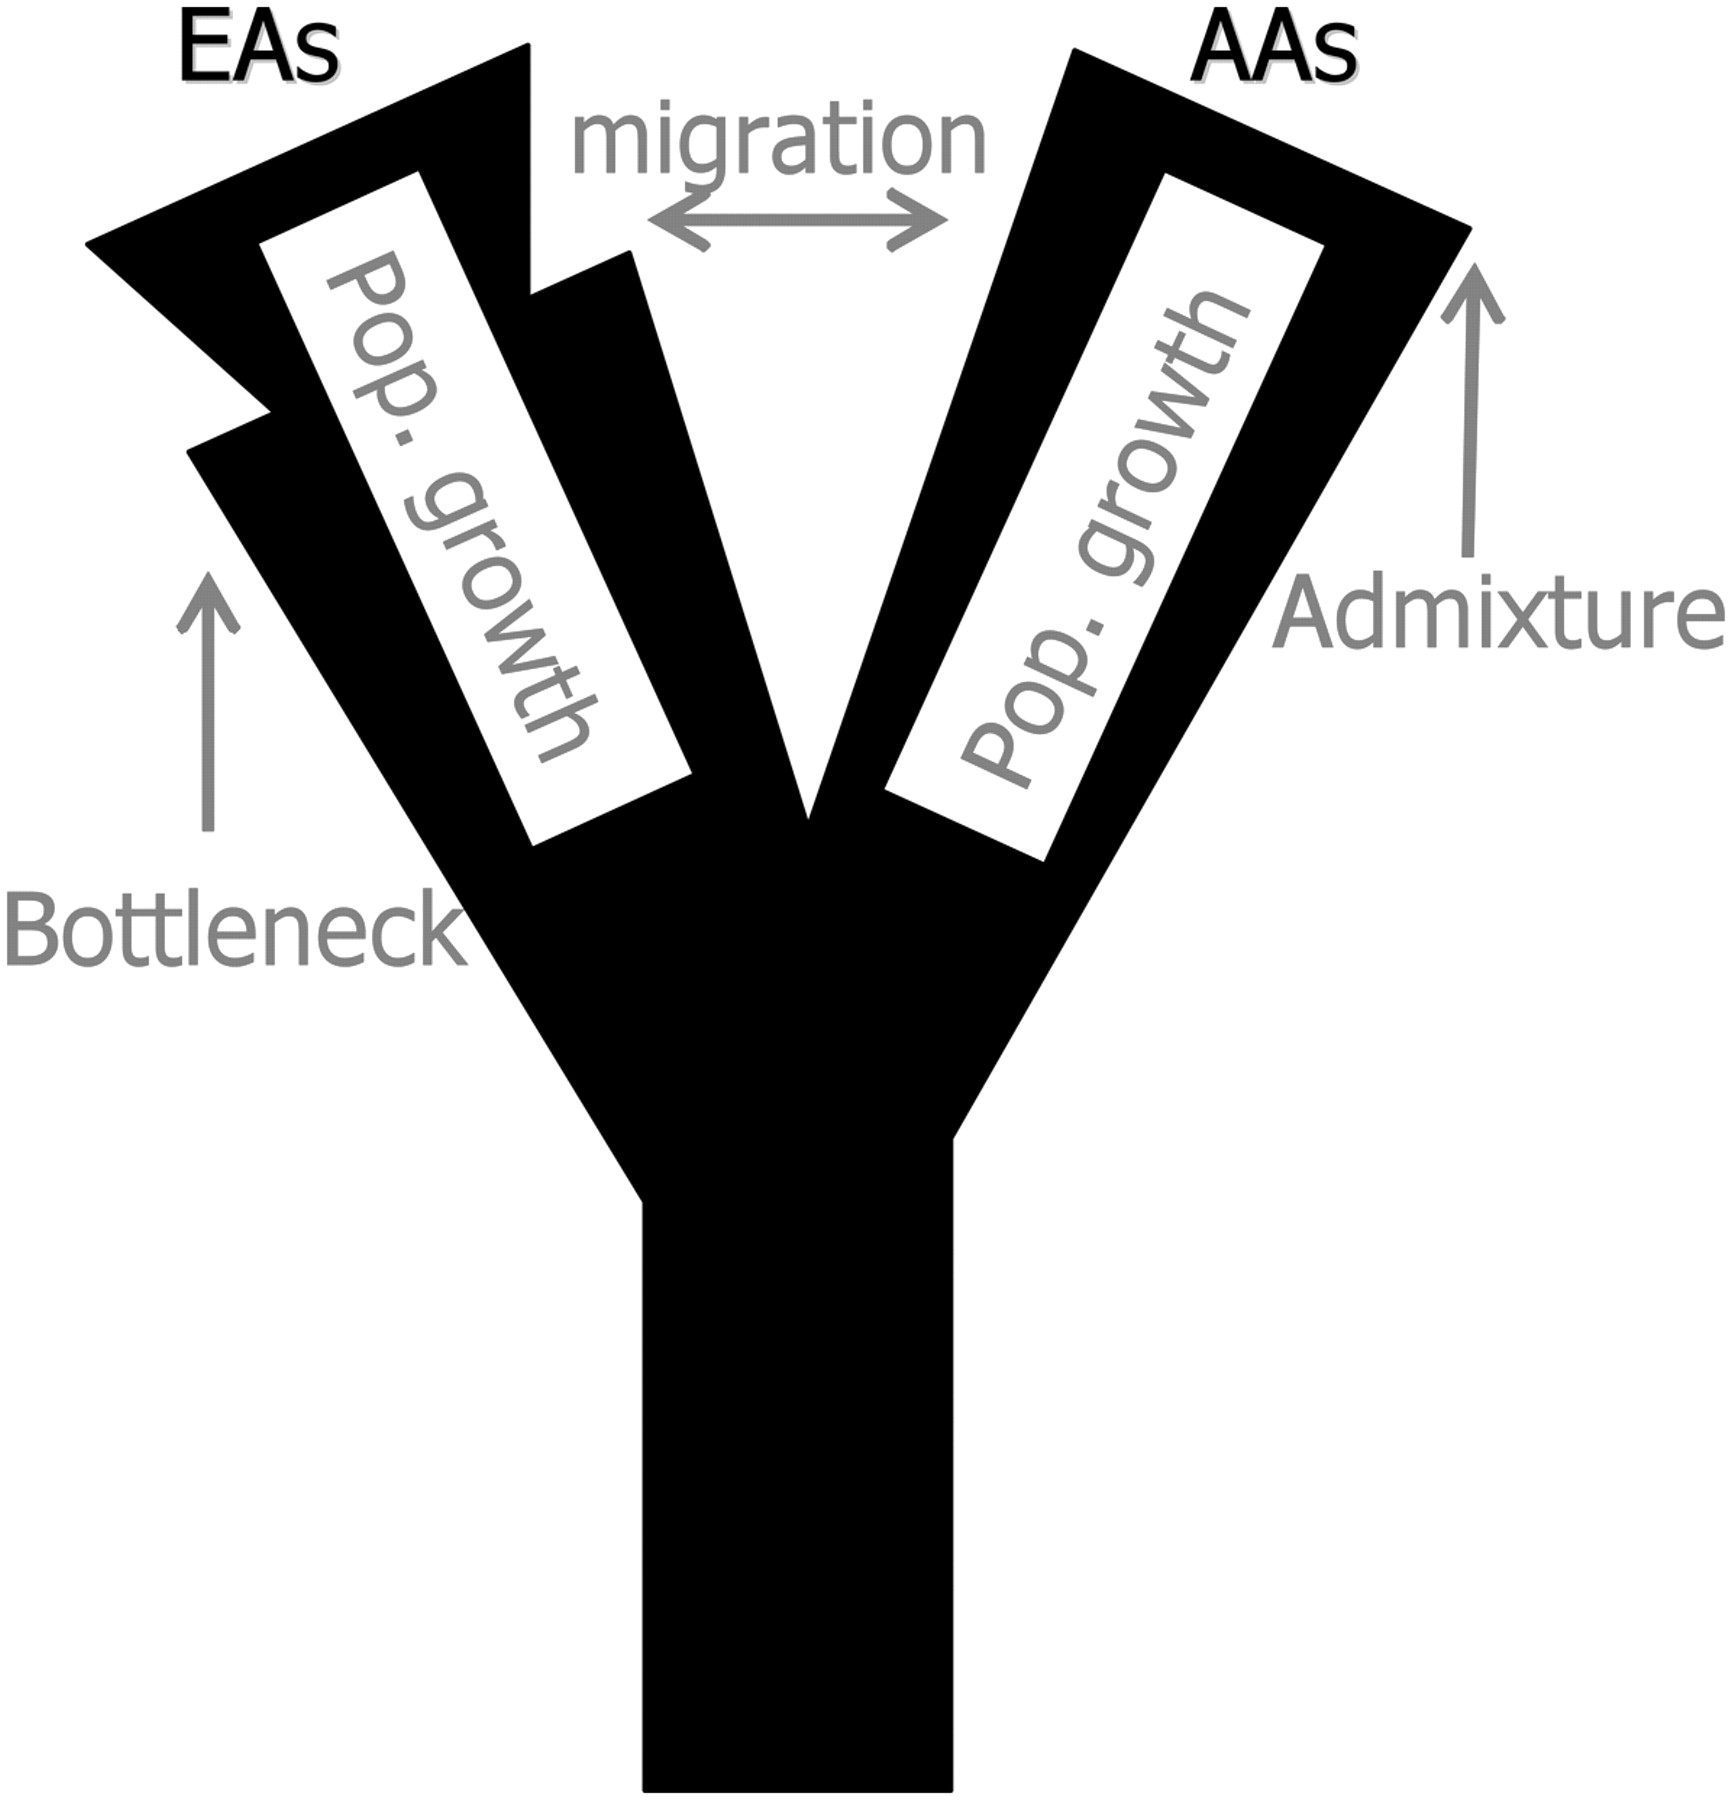
A graphical illustration of the model of the demographic history of European-Americans (EAs) and African-Americans (AAs).