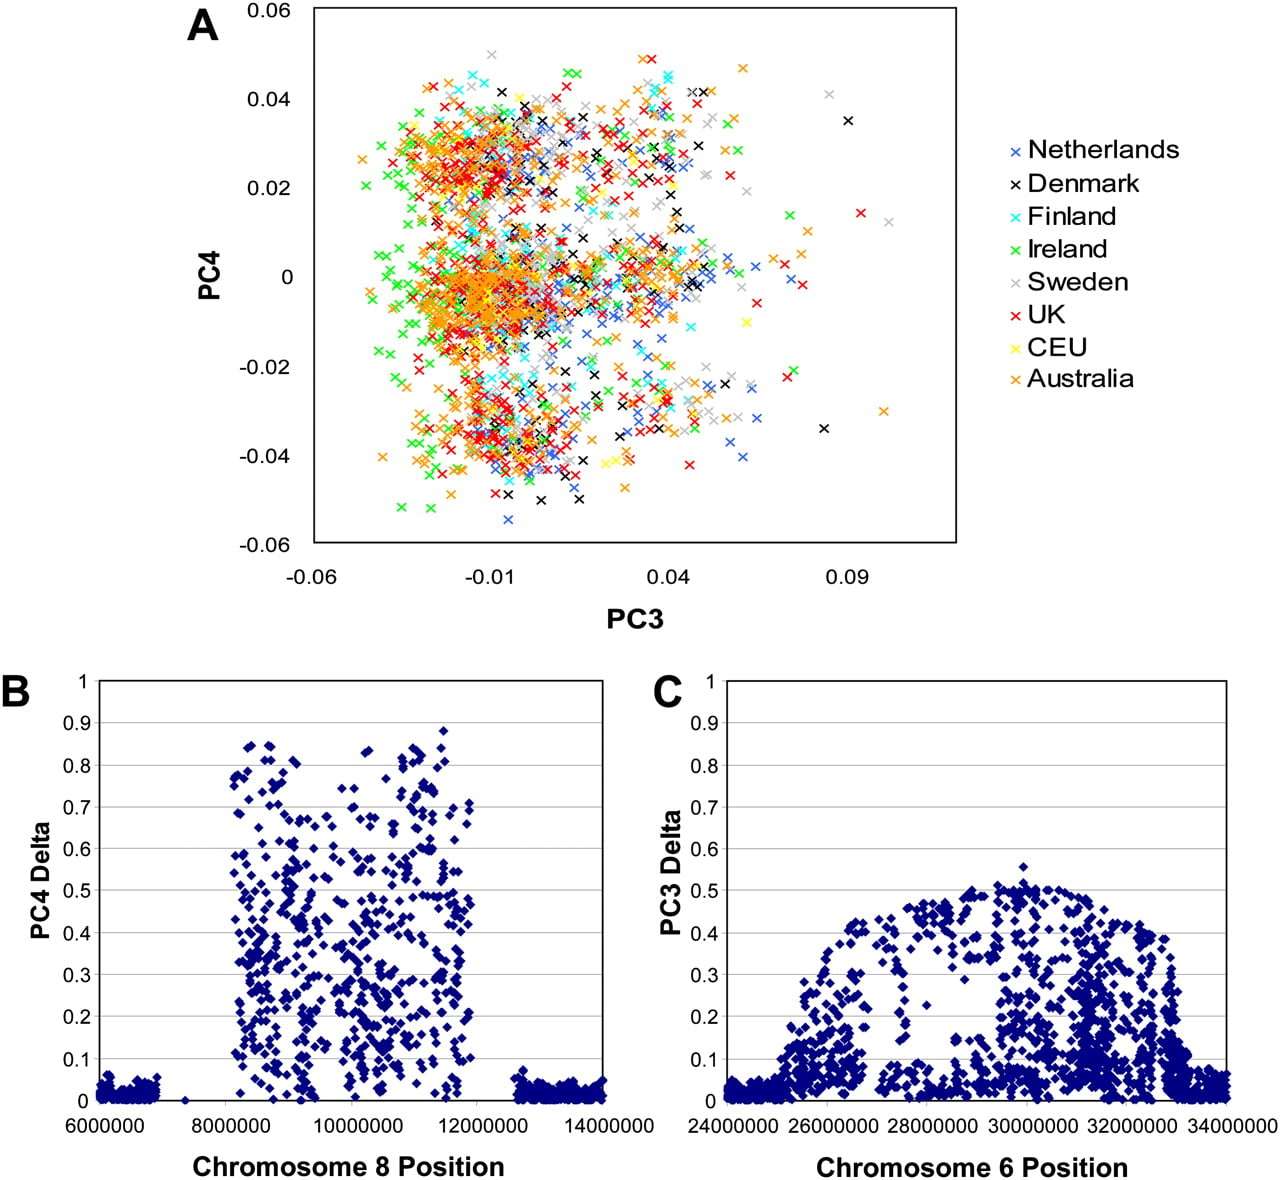
Figure 3.
PC3 and PC4 in Northern European populations. (A) PC3 versus PC4 derived from 2051 individuals genotyped for 296,553 autosomal SNPs. (B) An 8-Mb section of chromosome 8 (6 Mb to 14 Mb) showing the distribution of SNP δ values derived from extreme PC4 cohorts. (C) A 10-Mb section of chromosome 6 (24 Mb to 34 Mb) showing the distribution of SNP δ values derived from extreme PC3 cohorts. Whereas δ values remain high over the entire chromosome 8 inversion region (8 Mb to 12 Mb), those on chromosome 6 show a gradual decay upstream and downstream from the peak δ value observed at rs2508049 (position 29.99 Mb).